
Descrizione
🚀 Oltre 10.000 trader utilizzano già i nostri indicatori TOP🏆
Scopri perché i professionisti ci scelgono – gli strumenti più potenti su cTrader (indicatori, algoritmi e cBots) ti stanno aspettando.
👉 Ottieni tutti i nostri sistemi TOP qui:
_______________________________________________
_______________________________________________
📌 Indicatori di Struttura di Mercato
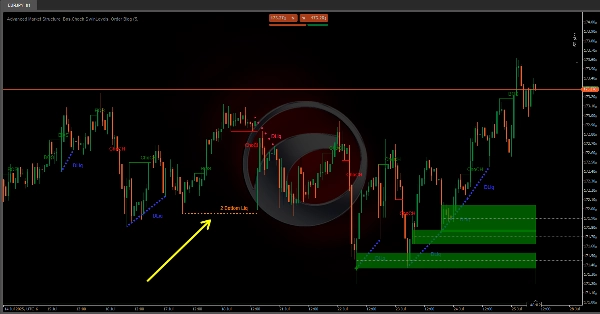
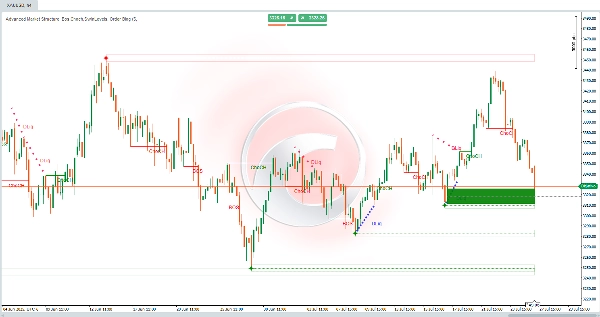
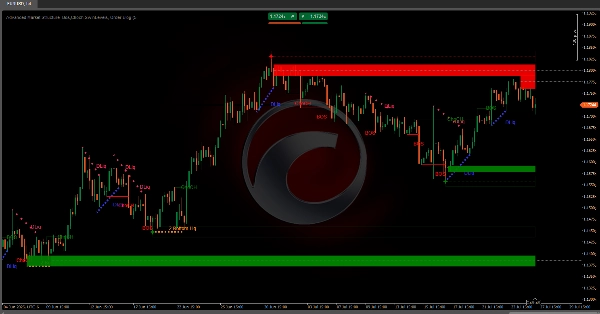
· ✅ AdvancedMarket Structure: Bos, Choch, SwinLevels, Order Blocks, Market Structure& Liquidity Finder
· 🔄 Analisi Dinamica della Struttura di Mercato dei Punti di Inversione
· 🧱 Order Block
· ⛓️ BOS & CHOCH
· 🧠 ICT Power of 3
· 🌀 Zone di Polarità di Mercato
______________________________________________________________-
Store cBots : 🧠 Gold & BTC BreakoutSession Pivots 🧠
_______________________________________________
🔚 Sistemi di Uscita Intelligenti
· 📍 Algoritmo Intelligente di Trailing
_______________________________________________
📐 Indicatori ZigZag
· 🔍 Proiezione della Liquidità del Prezzo ZigZag
· ➖ ZigZag
· 🎯 Tracker di Estremità Zig-Zag
_______________________________________________
🧱 Indicatori di Supporto e Resistenza
· 🟩 Linee di Supporto e Resistenza SmartTrend
· 🧱 Tutti i Livelli di Supporto e Resistenza
_______________________________________________
📊 Indicatori di Trend e Canale
· 🔄 Canale di Trend Automatico
· 📊 Supertrend
· ⚡Analizzatore di Trend Momentum
· 💥 Sistema di Breakout del Canale
· 🌈 Gradiente di Trend Dinamico
_______________________________________________
💧 Strumenti di Volume e Liquidità
· 🔥 Mappa di Calore Volume POC
· 📉 Mappa di Liquidazione della Leva
· 🕒 Sessioni di Fair Value Gap
_______________________________________________
⚡ Indicatori di Momentum e RSI
· 🔎 Tracker di Bias Multi-Livello delle Candele
_______________________________________________
🔮 Strumenti di Predizione e Proiezione
· 📐 Predizione Basata su Linreg& ATR
· 📏 Regressione Lineare di Fibonacci Multi-timeframe
· 📈 Proiettore di Flusso di Mercato Alimentato dal Volume
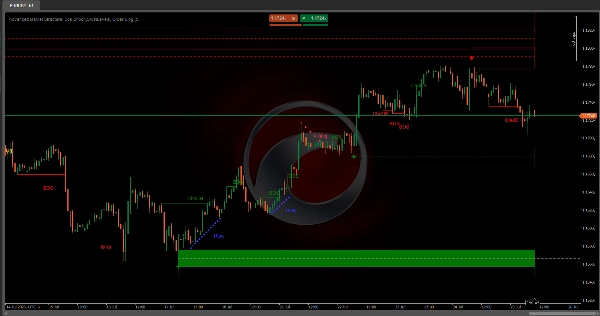
Advanced Market Structure: Bos, Choch, SwinLevels, Order Blocks, Market Structure & Liquidity Finder.
Cos'è?
Uno strumento avanzato di price action che combina molteplici concetti di analisi tecnica in un unico potente indicatore. Integra:
- 📊 Struttura di Mercato
- 🔄 Livelli Swing
- 🧱 Order Blocks
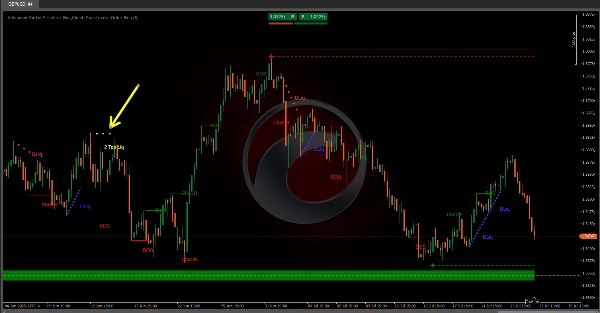
- 💧 Liquidity Finder (2 Bottoms & 2 Tops)
Obiettivo: Identificare punti chiave di ingresso/uscita, trend, supporto/resistenza e zone istituzionali dove il prezzo reagisce.
🧠 Filosofia Fondamentale: Smart Money
I mercati sono guidati da operatori istituzionali (banche, fondi, market maker) con risorse superiori. Creano schemi per:
- 🕵️♂️ Nascondere le operazioni durante accumulazione/distribuzione.
- 🎯 Cacciare la liquidità (stop loss retail).
- 🚀 Alimentare movimenti esplosivi in mercati squilibrati.
🔑 Componenti:
1. Order Blocks
- Cosa sono: Zone dove le istituzioni hanno eseguito ordini massicci, creando squilibri.
- Tipi:
-
- 🟢 Rialzista (Domanda): Acquisti istituzionali aggressivi.
- 🔴 Ribassista (Offerta): Vendite istituzionali aggressive.
- Segnale Chiave: Prezzo che rimbalza/inverte agli order blocks.
- Rilevamento:
-
- Picchi di volume vicino ai massimi (ribassista) o minimi (rialzista).
2. Livelli Swing
- Scopo: Definire la struttura di mercato tramite massimi/minimi chiave.
- Rotture Critiche:
-
- 🔺 Rottura del Massimo Swing: Continuazione rialzista.
- 🔻 Rottura del Minimo Swing: Continuazione ribassista.
3. Break of Structure (BoS)
- Definizione: Rottura decisiva di massimi swing (rialzista) o minimi (ribassista).
- Connessione Frattale:
-
- 🐂 Frattale Rialzista: Pattern di 5 candele con minimo centrale più basso.
- 🐻 Frattale Ribassista: Pattern di 5 candele con massimo centrale più alto.
4. Change of Character (ChoCh)
- Definizione: Cambiamento strutturale che segnala inversione di trend.
- Trigger:
-
- Rottura dei minimi swing in trend rialzisti (ChoCh ribassista).
- Rottura dei massimi swing in trend ribassisti (ChoCh rialzista).
5. Zone di Liquidità
- Tipi:
-
- ⚖️ Statiche: Livelli orizzontali con massimi/minimi raggruppati (filtrati ATR).
- 🏃 Dinamiche: Linee di tendenza che collegano pivot ripidi.
- Pattern Chiave:
-
- 🕯️ 2 Massimi/2 Minimi: Caccia agli stop istituzionali.
- ⛰️ Tripli Massimi/Minimi: Zone di alta congestione.
🎯 Applicazioni Chiave
- ✅ Identificare trend/inversioni tramite BoS/ChoCh.
- 📍 Localizzare supporto/resistenza usando livelli swing e zone di liquidità.
- 🏦 Individuare order blocks istituzionali.
- 🎯 Predire obiettivi di prezzo attraverso zone di liquidità.
🔄 Strategie Smart Money
Segnali di Fase Azione Istituzionale
1. Accumulazione
ChoCh rialzista + Order block di domanda 📈
Smart Money acquista
2. Markup
BoS consecutivi + gap FVG 🚀
Il retail alimenta il momentum
3. Distribuzione
ChoCh ribassista a 2 Top di Liquidità 🎯
Smart Money vende
4. Markdown
BoS ribassista + liquidazione in zona di sconto 🔻
Caccia agli stop ai minimi
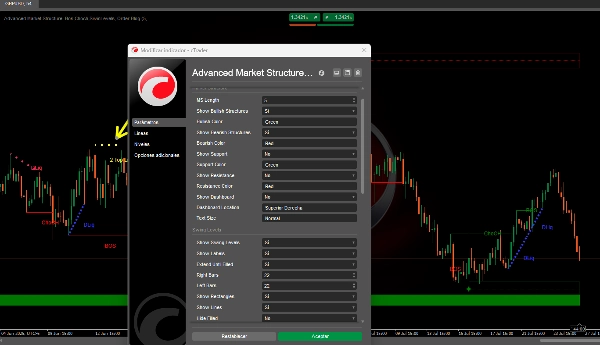
⚙️ Guida alla Regolazione dei Parametri
Struttura di Mercato
Lunghezza MS:-
- ⬆️ Aumenta: Meno frattali ma più affidabili.
- ⬇️ Diminuisci: Più sensibile (rischio di rumore).
Livelli Swing
SwingSizeL/R:-
- ⬆️ Aumenta: Identifica swing significativi.
- ⬇️ Diminuisci: Cattura inversioni minori.
Estendi fino al completamento:-
- ✅ Abilitato: I livelli persistono fino a quando il prezzo li raggiunge.
Order Blocks
Metodo di Mitigazione:-
- ✨
Wick: Segnali più rapidi (tocca lo stoppino). - 🎯
Close: Segnali più forti (chiude fuori dal blocco).
- ✨
Liquidity Finder
Sensibilità Statica/Dinamica:-
- ⬆️ Aumenta: Meno zone (qualità superiore).
- ⬇️ Diminuisci: Più zone (maggiore sensibilità).
Riepilogo
Key components include:
- **Order Blocks:** Zones of significant institutional buying (bullish) or selling (bearish) identified by volume spikes near highs or lows, signaling potential price rebounds or reversals.
- **Swing Levels:** Critical highs and lows defining market structure, with breaks indicating bullish or bearish continuations.
- **Break of Structure (BoS):** Decisive breaks of swing highs or lows, linked to fractal patterns, signaling trend direction.
- **Change of Character (ChoCh):** Structural shifts indicating trend reversals, triggered by breaking swing lows in uptrends or swing highs in downtrends.
- **Liquidity Zones:** Static (horizontal levels with clustered highs/lows) and dynamic (trendlines connecting pivots) zones highlighting institutional stop hunts and congestion areas.
The indicator supports smart money concepts, reflecting institutional market behavior phases: Accumulation, Markup, Distribution, and Markdown. Parameter tuning options allow adjustment of sensitivity and signal strength for Market Structure, Swing Levels, Order Blocks, and Liquidity Finder components. This tool aims to enhance market analysis by revealing institutional activity and improving trade decision-making.
Recensioni dei clienti
5 | 33 % | |
4 | 67 % | |
3 | 0 % | |
2 | 0 % | |
1 | 0 % |


