
Descrizione
COS'È E COSA FA
La Media Mobile Supertrend affronta una limitazione fondamentale delle medie mobili tradizionali: periodi fissi che non si adattano mai a come le tendenze si sviluppano realmente.
I periodi brevi reagiscono rapidamente ma sono soggetti a falsi segnali. I periodi lunghi smussano il rumore ma ritardano notevolmente durante movimenti forti. Qualunque sia l'impostazione, sei costretto a indovinare un numero e sperare che il mercato collabori.
Questo indicatore elimina questa incertezza.
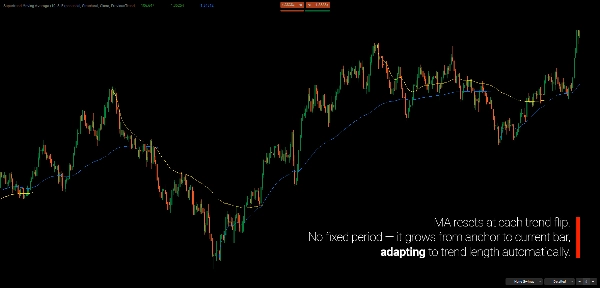
Invece di calcolare la media del prezzo su un numero arbitrario di barre, calcola la media mobile dal momento in cui la tendenza attuale inizia strutturalmente. Più a lungo dura la tendenza, più la MA diventa naturalmente lunga. Le tendenze brevi rimangono reattive. Le tendenze prolungate diventano più fluide — automaticamente.
Il risultato è una media mobile che cresce con la tendenza, non contro di essa.
Ancorata ai cambiamenti strutturali basati su Supertrend, questa MA si adatta al ritmo del mercato in tempo reale, senza ottimizzazione, adattamenti artificiali o regolazioni manuali. La struttura definisce il periodo — non il trader.
PERCHÉ STRUCTURAL SUPERTREND?
Il Supertrend originale cambia direzione quando il prezzo chiude oltre la sua banda. Questo funziona bene in tendenze pulite ma crea una frustrazione comune: falsi segnali durante condizioni instabili.
Il Problema
Una singola candela volatile che chiude leggermente oltre la banda innesca un cambio — anche quando la tendenza più ampia rimane intatta. I trader che seguono il Supertrend originale spesso sperimentano:
- Falsi segnali durante la consolidazione
- Uscite premature da tendenze valide
- Rientri a prezzi peggiori dopo inversioni false
La Soluzione
Structural Supertrend estende il concetto originale di Supertrend per riflettere meglio i cambiamenti strutturali piuttosto che la volatilità momentanea. Filtra il rumore aspettando la conferma che un vero cambiamento direzionale sia avvenuto.
Il risultato sono meno falsi cambi e un migliore allineamento con i cambiamenti reali della tendenza.
Perché mantenere entrambi?
Il Supertrend originale non è inutile — risponde a una domanda diversa.
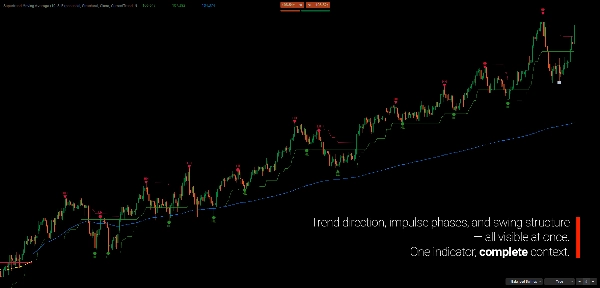
- Structural mostra la tendenza principale (il "quadro generale")
- Original mostra i cambiamenti di momentum all'interno di quella tendenza (impulso vs. correzione)
Quando entrambe le linee sono allineate: forte convinzione direzionale. Quando divergono: il movimento potrebbe essere correttivo, non una vera inversione.
Questa visione a doppio livello ti offre un contesto che nessuna linea fornisce da sola.
IL CONCETTO FONDAMENTALE
Le MA tradizionali rispondono a: "Qual è il prezzo medio su N barre?"
Questo indicatore risponde a: "Qual è il prezzo medio da quando è iniziata la tendenza attuale?"
La MA è costruita direttamente su Supertrend:
- Supertrend rileva un cambio di tendenza
- L'indicatore trova la chiusura estrema della tendenza precedente (massimo per nuova tendenza ribassista, minimo per nuova tendenza rialzista)
- La MA si ancora a quel punto e calcola in avanti fino alla barra corrente
- Quando Supertrend cambia di nuovo, la MA si resetta a un nuovo ancoraggio
Il Supertrend definisce la tendenza. La MA la misura. Lavorano come un sistema unico — non come strumenti separati.
Scegli quale Supertrend guida la MA:
- Structural — meno reset, traccia la tendenza principale
- Original — più reset, traccia il momentum a breve termine
CARATTERISTICHE PRINCIPALI
Analisi Doppia Supertrend
- Structural Supertrend identifica la direzione della tendenza principale usando un modello Supertrend strutturalmente adattato
- Original Supertrend rivela il comportamento impulsivo vs. correttivo all'interno della tendenza
- Il confronto visivo mostra quando entrambi concordano (convinzione) vs. divergono (cautela)
Media Mobile Adattiva Basata su Ancoraggio
- La MA si ancora automaticamente alla chiusura estrema della tendenza precedente
- Il periodo cresce dinamicamente dal punto di ancoraggio — nessuna impostazione fissa richiesta
- Tre tipi di MA: Semplice, Esponenziale, Arnaud Legoux (ALMA)
- Codificata a colori in base alla direzione della tendenza per un riconoscimento immediato del bias
Contesto Multi-Timeframe
- Applica il calcolo della MA al Supertrend di timeframe superiore mentre visualizzi grafici di timeframe inferiore
- Vedi la MA della tendenza giornaliera sul tuo grafico H1 senza cambiare timeframe
- Rilevamento automatico del requisito di barre con avvisi chiari
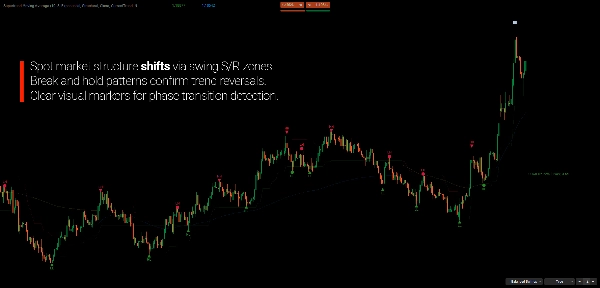
Rilevamento Integrato degli Swing
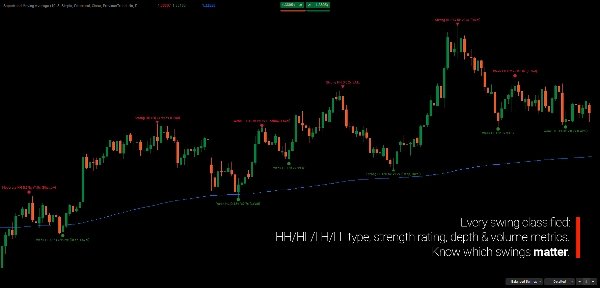
- Tre modalità di rilevamento: Minore, Bilanciato, Maggiore
- Classificazione della forza dello swing (Debole, Moderato, Forte)
- Etichette HH/HL/LH/LL confermano la struttura della tendenza
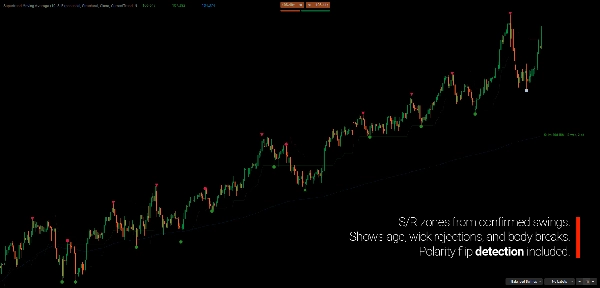
- Zone S/R opzionali con tracciamento del cambio di polarità
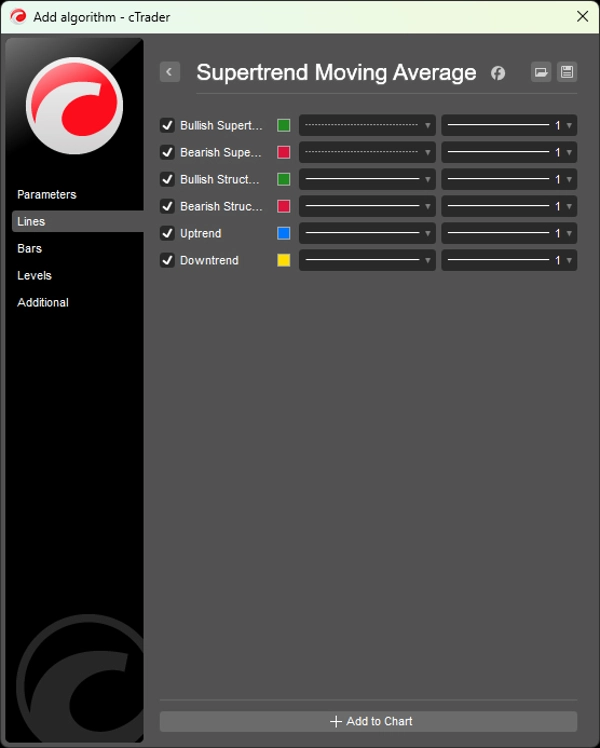
LETTURA DEL GRAFICO
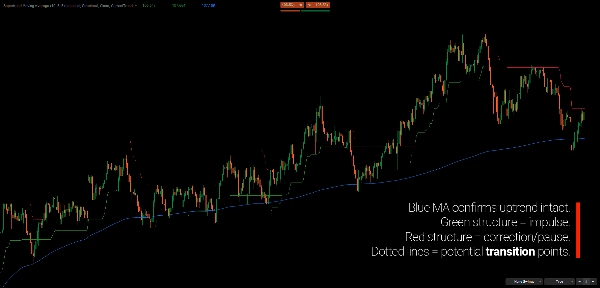
- Linea Strutturale Verde: Tendenza strutturale rialzista (supporto)
- Linea Strutturale Rossa: Tendenza strutturale ribassista (resistenza)
- Linea Punteggiata: Supertrend originale — mostra quando la struttura differisce da quella classica
- MA Blu: Media della tendenza rialzista dall'ancoraggio
- MA Gialla: Media della tendenza ribassista dall'ancoraggio
- Marcatori Swing: Punti di svolta confermati con icone di forza
Controllo di Allineamento della Tendenza:
- Struttura + Originale concordano → Movimento ad alta convinzione
- Struttura + Originale divergono → Potenziale correzione o transizione
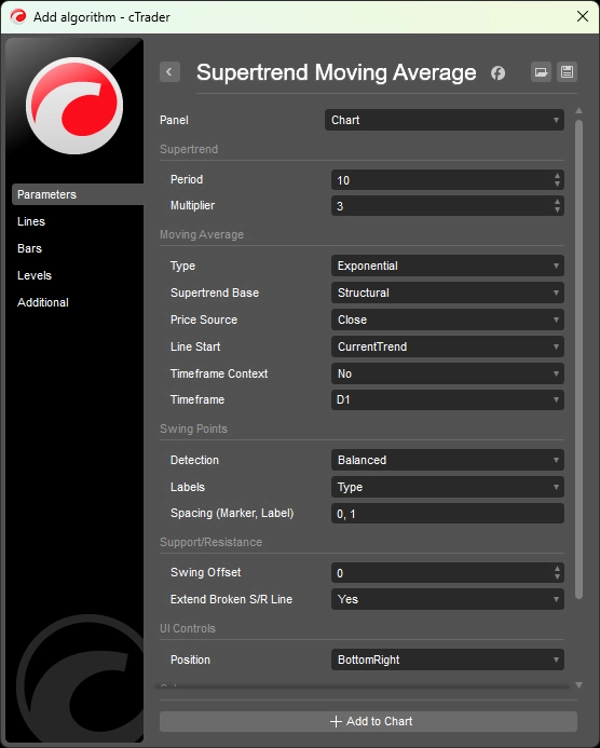
PARAMETRI
Supertrend
- Periodo (default: 10)
- Moltiplicatore (default: 3.0)
Media Mobile
- Tipo: Nessuno, Semplice, Esponenziale, Media Mobile Arnaud Legoux (ALMA)
- Base Supertrend: Structural (default) o Original
- Fonte Prezzo: Chiusura, Apertura, Massimo, Minimo, Mediana, Tipico, Media
- Inizio Linea: Tendenza Corrente o Tendenza Precedente
- Contesto Timeframe: Abilita/disabilita con selezione timeframe
Punti Swing
- Modalità di Rilevamento: Nessuno, Minore, Bilanciato, Maggiore
- Visualizzazione Etichette: Nessuno, Tipo (HH/LL), Dettagliato
- Colori e spazi personalizzabili
A CHI È RIVOLTO
Questo indicatore è progettato per trader che pensano in termini di struttura piuttosto che di segnali.
Se ti interessa più capire dove ti trovi all'interno di una tendenza che inseguire ingressi perfetti, questo strumento è stato creato pensando a te.
È adatto a trader di tendenza e swing che vogliono un modo oggettivo per seguire lo sviluppo della tendenza senza affidarsi a medie mobili a periodo fisso o a ottimizzazioni costanti dei parametri.
Gli analisti multi-timeframe trarranno beneficio nel vedere il contesto strutturale di timeframe superiore direttamente sui grafici di esecuzione, mentre i trader discrezionali possono usare la MA ancorata come riferimento dinamico per ritracciamenti, continuazioni e esaurimento della tendenza.
Non è un generatore di segnali plug-and-play. È un quadro contestuale per trader che valorizzano chiarezza, coerenza e logica strutturale nelle loro decisioni.
COS'È CHE LO RENDE DIVERSO
Le decisioni di trading spesso comportano un compromesso noto: veloce ma rumoroso, o fluido ma in ritardo.
Questo indicatore si adatta a come il mercato si sviluppa realmente. Le tendenze brevi producono MA reattive. Le tendenze prolungate evolvono naturalmente in MA più fluide. Non è richiesta alcuna ottimizzazione — la struttura definisce il periodo.
Confrontando Structural e Original Supertrend, l'indicatore fornisce un contesto chiaro per distinguere tra continuazione della tendenza e movimento correttivo all'interno della tendenza.
---
COMPRENDERE LA STRUTTURA DEL MERCATO
La struttura del mercato è lo studio di come il prezzo evolve attraverso sequenze di espansione e contrazione, piuttosto che candele o indicatori isolati. Le tendenze non sono definite da singoli movimenti, ma dalla relazione tra gli swing — massimi più alti e minimi più alti nelle tendenze rialziste, massimi più bassi e minimi più bassi nelle tendenze ribassiste.
Da questa prospettiva, una tendenza non è qualcosa da prevedere, ma qualcosa da osservare e convalidare. Ciò che conta non è se il prezzo sta salendo o scendendo sulla barra corrente, ma se la struttura sottostante rimane intatta o inizia a degradarsi.
Per questo motivo l'analisi basata sulla struttura si concentra meno sul timing di ingressi perfetti e più sul contesto: dove si trova il mercato nella sua fase attuale, se i movimenti sono impulsivi o correttivi, e come le nuove informazioni si inseriscono nella struttura esistente.
Gli indicatori costruiti attorno alla struttura del mercato non sono pensati per sostituire il processo decisionale, ma per supportare un'interpretazione più chiara di ciò che il prezzo sta già comunicando.
---
Il trading comporta rischi. Questo indicatore è uno strumento di analisi tecnica — applica sempre una corretta gestione del rischio.
Riepilogo
The indicator integrates dual Supertrend analyses: a Structural Supertrend that identifies major trend direction by filtering out noise and confirming genuine directional changes, and the Original Supertrend that highlights momentum shifts within the trend. Comparing these two provides context for distinguishing strong trend continuation from corrective movements.
Key features include:
- Adaptive anchor-based moving averages with options for Simple, Exponential, or Arnaud Legoux (ALMA) types.
- Multi-timeframe capability to apply higher timeframe Supertrend context on lower timeframe charts.
- Integrated swing detection with configurable modes and strength classification.
- Color-coded trend lines and swing markers for clear visual interpretation.
This tool is suited for trend and swing traders, multi-timeframe analysts, and discretionary traders seeking a structural framework to track trend development and market rhythm objectively. It emphasizes market structure and context over fixed signals, supporting clearer interpretation of price behavior.
Recensioni dei clienti
5 | 100 % | |
4 | 0 % | |
3 | 0 % | |
2 | 0 % | |
1 | 0 % |


