
Descrizione
La levigatura Jurik comprende 3 fasi:
1ª fase - levigatura preliminare mediante EMA adattiva: MA1 = (1-alpha)*Price + alpha*MA1[1];
2ª fase - un'ulteriore levigatura preliminare tramite filtro di Kalman: Det0 = (Price - MA1)*(1-beta) + beta*Det0[1]; MA2 = MA1 + PR*Det0;
3ª fase - levigatura finale tramite unico filtro adattivo Jurik: Det1 = (MA2 - JMA[1]) * (1-alpha)^2 + alpha^2 * Det1[1]; JMA = JMA[1] + Det1;
dove: - Price - serie dei prezzi - alpha - fattore dinamico (sarà descritto di seguito) - beta - rapporto periodico = 0.45*(Length-1)/(0.45*(Length-1)+2) - PR - rapporto di fase: PR = Phase/100 + 1.5 (se Phase < -100 allora PR=0.5, se Phase > 100 allora PR=2.5).
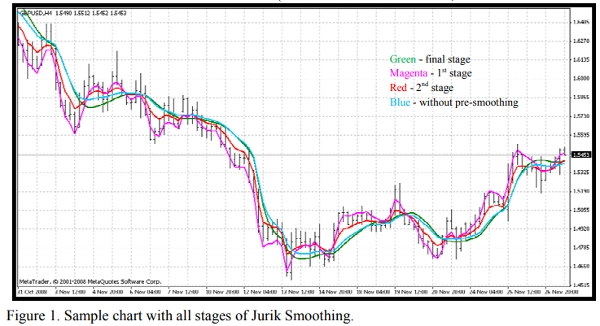
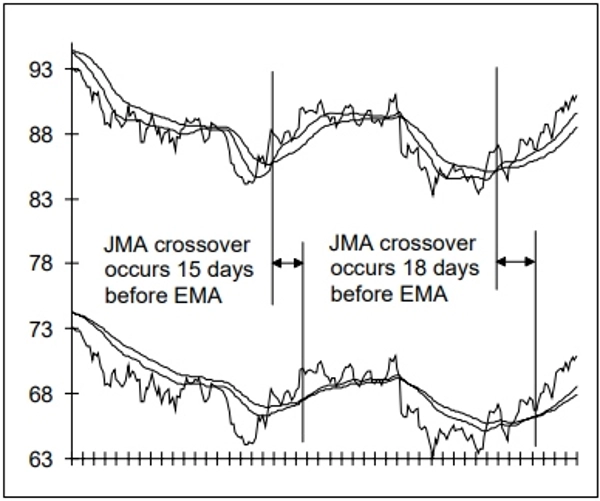
Figura 1. Grafico di esempio con tutte le fasi della levigatura Jurik. È possibile vedere i risultati (Figura 1) di ogni fase tramite l'indicatore allegato JurikFilter_v2, modificando FilterMode: 0 - fase finale (JMA) 1 - 1ª fase 2 - 2ª fase 3 - solo levigatura finale (senza preliminare).
Il Fattore Dinamico è un fattore periodico (beta) elevato a una potenza (pow):
alpha = beta ^ Pow,
dove: - pow = rVolty ^ pow1 - rVolty - volatilità relativa del prezzo - pow1 - potenza della volatilità relativa con la seguente formula: pow1 = len1 - 2 (se pow1 < 0.5 allora pow1 = 0.5),
dove len1 - fattore periodico aggiuntivo: len1 = Log(SquareRoot(len))/Log(2.0) + 2 (se len1 < 0 allora len1 = 0).
Quindi si può vedere che il fattore dinamico si basa sulla volatilità relativa del prezzo fornendo l'adattabilità richiesta per questo tipo di filtro del prezzo.
La formula per la volatilità relativa del prezzo è rVolty = Volty/AvgVolty (se rVolty > len1^(1/pow1) allora rVolty = len1^(1/pow1), se rVolty < 1 allora rVolty = 1),
dove:
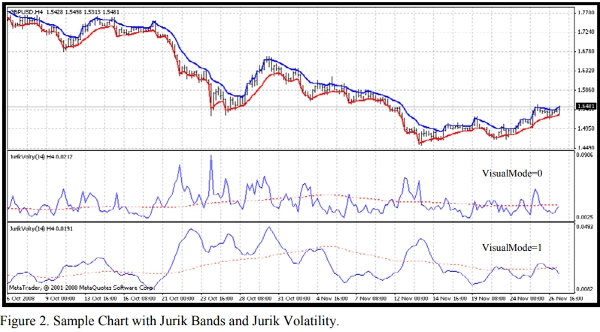
- Volty - volatilità del prezzo basata sul calcolo delle cosiddette Jurik Bands (VisualMode = 1).
- AvgVolty - volatilità media per la quale Jurik utilizza un algoritmo di calcolo abbastanza complesso: AvgVolty = Average(vSum,AvgLen),
dove:
- vSum - somma incrementale di (Volty - Volty[10])/10;
- AvgLen - periodo della media (Jurik usa 65).
Nella mia versione del filtro Jurik uso una media semplice invece della media complessa di Jurik
Inoltre, con l'indicatore allegato JurikVolty_v1 (Figura 2) è possibile vedere i valori di Volty (VisualMode=0), vSum (VisualMode=1) e AvgVolty (linea rossa tratteggiata).
La formula per la volatilità del prezzo è Volty = massimo tra Abs(del1) e Abs(del2), se Abs(del1) = Abs(del2) allora Volty = 0,
dove: - del1 - distanza tra prezzo e banda superiore del1 = Price - UpperBand - del2 - distanza tra prezzo e banda inferiore del2 = Price - LowerBand Le Jurik Bands sono diverse da qualsiasi banda di prezzo conosciuta come Bollinger, Keltner, Donchian, Fractal e così via: se del1 > 0 allora UpperBand = Price altrimenti UpperBand = Price - Kv*del1 se del2 < 0 allora LowerBand = Price altrimenti LowerBand = Price - Kv*del2,
dove: - Kv - fattore di volatilità Kv = bet ^ SquareRoot(pow2). È facile vedere che queste bande possono essere una base per un indicatore di trend following come il Parabolico di Wilder. Quindi, si può vedere che praticamente non ci sono punti oscuri nell'algoritmo della Media Mobile Jurik (JMA)
Riepilogo
Recensioni dei clienti
5 | 0 % | |
4 | 100 % | |
3 | 0 % | |
2 | 0 % | |
1 | 0 % |


![Logo di "[CB] Pivot Points Pro"](https://cdn.ctrader.com/image/webp/43463c82-67b0-4f10-a4ba-901bba091d81_32594)


