
Descrizione
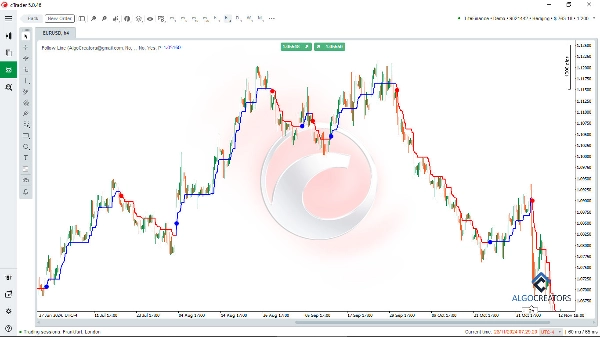
L'indicatore Follow Line è un potente indicatore cTrader per l'analisi tecnica, che aiuta i trader a identificare i punti ottimali di ingresso e uscita nei mercati finanziari. Combinando le Bande di Bollinger e l'indicatore ATR, filtra le tendenze e fornisce segnali affidabili di acquisto e vendita.
Con questo indicatore, puoi facilmente individuare tendenze di mercato al rialzo o al ribasso e seguire segnali ad alta affidabilità.
I trader possono combinare l'indicatore Follow Line con strumenti avanzati come il cTrader indicatore Smart Money Assistant e oscillatori come il MACD per migliorare la loro analisi e confermare le entrate di trading.
Le sue impostazioni personalizzabili e gli avvisi in tempo reale lo rendono un'aggiunta preziosa a qualsiasi strategia di trading, permettendo agli utenti di eseguire operazioni di successo con fiducia e precisione.
Caratteristiche principali:
- Rilevamento della tendenza: Usa il Follow Line per identificare tendenze di mercato rialziste o ribassiste.
- Segnali di acquisto/vendita: Mostra segnali accurati di acquisto e vendita basati sulle rotture delle Bande di Bollinger.
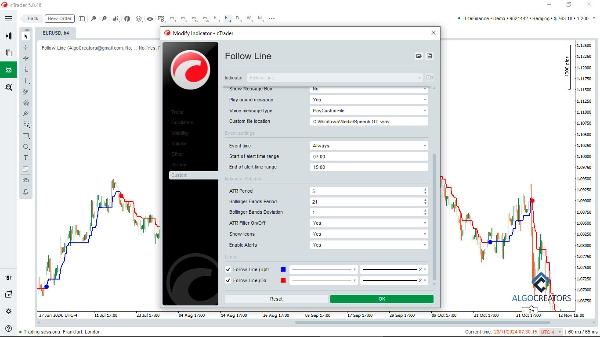
- Filtro ATR: Opzione per abilitare o disabilitare il filtro ATR per una maggiore precisione dei segnali.
- Impostazioni personalizzabili: Regola il periodo delle Bande di Bollinger, la deviazione standard e il periodo ATR.
- Rappresentazione visiva: Mostra i segnali sul grafico usando icone intuitive (frecce o linee).
- Avvisi: Ricevi avvisi istantanei ogni volta che appare un segnale di acquisto o vendita.
Questo indicatore è altamente personalizzabile, permettendo ai trader di regolare i periodi delle Bande di Bollinger, le deviazioni standard e le impostazioni ATR per adattarsi alla loro strategia. Gli indicatori visivi e gli avvisi istantanei lo rendono facile da usare ed efficace sia per lo scalping che per il swing trading. Con caratteristiche come il rilevamento della tendenza, la gestione del rischio e le impostazioni personalizzabili, l'indicatore Follow Line è ideale per trader forex, criptovalute e azioni che mirano a migliorare la loro analisi tecnica e le prestazioni di trading.
Perfetto per identificare opportunità di mercato precise!
Riepilogo
Users can customize settings such as Bollinger Bands period, standard deviation, and ATR period to align with their trading strategies. The indicator visually represents signals on the chart using intuitive icons like arrows or lines and provides real-time alerts when signals occur. It supports various trading styles, including scalping and swing trading, and is suitable for forex, cryptocurrency, and stock markets.
The Follow Line indicator can be combined with other tools like the cTrader Smart Money Assistant and MACD oscillators to confirm trade entries and enhance analysis. Its customizable features and alert system assist traders in identifying precise market opportunities and managing risk effectively.
Recensioni dei clienti
5 | 60 % | |
4 | 20 % | |
3 | 20 % | |
2 | 0 % | |
1 | 0 % |


