


Descrizione
Previsione dei Prezzi Basata su MACD
Panoramica
Questo indicatore supera i limiti del MACD tradizionale andando oltre l'analisi storica, introducendo in modo innovativo memoria storica e algoritmi statistici per prevedere l'azione futura del prezzo.
Meccaniche Principali:
- Memoria della Tendenza Storica: L'indicatore registra lo spostamento del prezzo delle tendenze MACD passate (sia rialziste che ribassiste) rispetto ai loro punti di partenza, costruendo un database statistico di fino a 50 tendenze recenti.
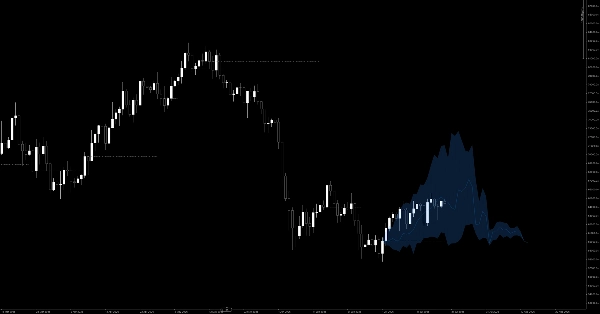
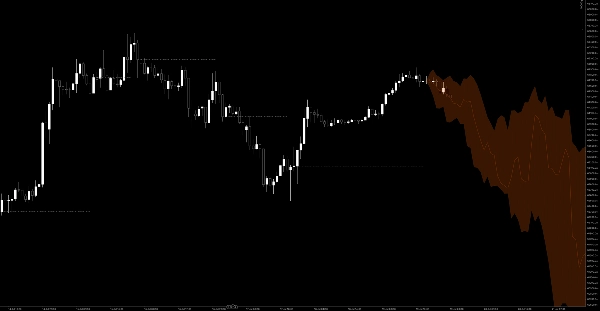
- Ventaglio di Previsione Probabilistica: Quando si verifica un nuovo crossover MACD (sia attraversando la linea zero che la linea di segnale), l'indicatore recupera i dati dalla memoria storica. Calcola i percentili 20%, 50% e 80% delle variazioni di prezzo e proietta un ventaglio di previsione probabilistica per i prossimi 100 barre alla destra del grafico.
- Nuvola Dinamica dell'Area di Segnale: Segna il "Prezzo di Riferimento" da cui ha avuto origine l'inversione di tendenza. Quando il prezzo in tempo reale è sopra questo prezzo di riferimento in un trend rialzista, dipinge un'area nuvola verde; al contrario, dipinge una nuvola rossa in un trend ribassista. Questo fornisce una conferma visiva immediata del reale slancio rialzista o ribassista.
(Nota: Questo indicatore presenta un rendering grafico altamente ottimizzato, utilizzando una fusione poligonale senza soluzione di continuità per zone visive chiare e una linea di riferimento discontinua raffinata per un'esperienza di grafico incredibilmente pulita.)
Regole di Trading e Guida per l'Utente
Questo indicatore va oltre i semplici segnali "compra/vendi al crossover"—ti fornisce una mappa probabilistica per i tuoi trade.
1. Trovare gli Ingressi (Conferma del Trend)
- Ingressi Long: Quando si verifica un crossover MACD rialzista, apparirà un ventaglio di previsione blu che proietta verso l'alto alla destra. Non entrare alla cieca. Aspetta di vedere se il prezzo si stabilizza sopra la linea tratto-punto (Prezzo di Riferimento) e una nuvola verde rialzista inizia ad espandersi. Questo conferma che l'attuale slancio corrisponde alle statistiche storiche rialziste, offrendo un'opportunità solida per comprare al ribasso.
- Ingressi Short: Quando si verifica un crossover MACD ribassista, apparirà un ventaglio di previsione arancione che proietta verso il basso . Cerca che il prezzo rimanga sotto la linea di riferimento con una nuvola rossa ribassista in espansione per confermare un ingresso short su un ritracciamento.
2. Impostare gli Obiettivi di Take Profit
Il ventaglio di previsione funge da eccellente guida dinamica per il take-profit:
- Obiettivo 1 (La Linea Centrale): La linea centrale all'interno del ventaglio rappresenta il percentile storico al 50% (la traiettoria media). Quando il prezzo tocca questa linea, significa che il movimento attuale ha raggiunto la media storica, rendendolo un punto ideale per prendere profitti parziali.
- Obiettivo 2 (I Bordi Esterni del Ventaglio): Il confine superiore (percentile 80%) o il confine inferiore (percentile 20%) rappresentano gli estremi storici. Se il prezzo raggiunge questi bordi, lo slancio è fortemente esaurito e una inversione o un ritracciamento profondo è altamente probabile. Considera di chiudere l'intera posizione.
3. Posizionamento Scientifico dello Stop Loss
- La linea grigia tratteggiata (Prezzo di Riferimento) funziona come linea base per ogni trend.
- Quando si va long, posiziona lo stop loss leggermente sotto questa linea grigia. Se il prezzo scende sotto il prezzo di riferimento e la nuvola verde scompare, significa che l'azione reale del prezzo ha invalidato la probabilità rialzista storica. L'impostazione del trend è fallita e dovresti tagliare le perdite immediatamente.
4. Filtro per Mercato Laterale
- Se si verifica un crossover MACD ma il ventaglio di previsione proiettato appare molto piatto o contratto, significa che storicamente crossover simili hanno prodotto solo movimenti laterali e incerti.
- Quando vedi un ventaglio piatto, resta fermo e evita di fare trading. Aspetta il prossimo ciclo in cui il ventaglio mostri una chiara espansione verso l'alto o verso il basso.
Riepilogo
Key features include a probability forecasting fan that projects 20%, 50%, and 80% price change percentiles for the next 100 bars following a MACD crossover. The indicator visually displays this fan on the chart, with blue fans for bullish signals and orange for bearish. A dynamic signal area cloud highlights momentum: green for confirmed uptrends above a reference price and red for downtrends below it.
Trading guidance involves waiting for price confirmation above or below the reference price and cloud before entering long or short positions. The forecasting fan also serves as a dynamic take-profit guide, with the middle line representing average historical moves and outer edges indicating potential trend exhaustion. Stop-loss placement is recommended just beyond the reference price line to manage risk.
Additionally, the indicator filters ranging markets by identifying flat or contracted fans, signaling sideways price action and advising traders to avoid entering trades during such periods. The indicator supports visualization outputs and is tagged under MACD and momentum indicators.




















