Descrizione
Mappa di Calore della Liquidità - Analisi Professionale dei Pivot Multi-Temporale
Trasforma il tuo trading con una visualizzazione avanzata della liquidità. Questo potente indicatore rivela le zone di liquidità istituzionale analizzando i punti pivot su 10 diversi timeframe simultaneamente, creando una mappa di calore dinamica che mostra esattamente dove è probabile che si trovi il denaro intelligente.
Come Funziona
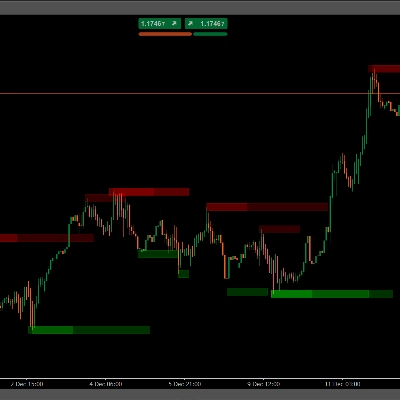
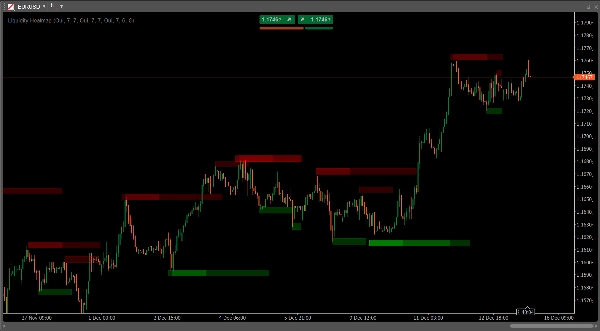
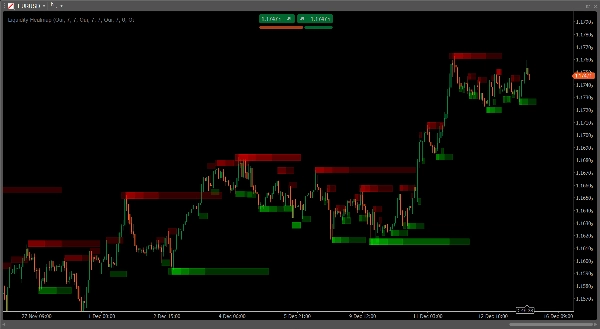
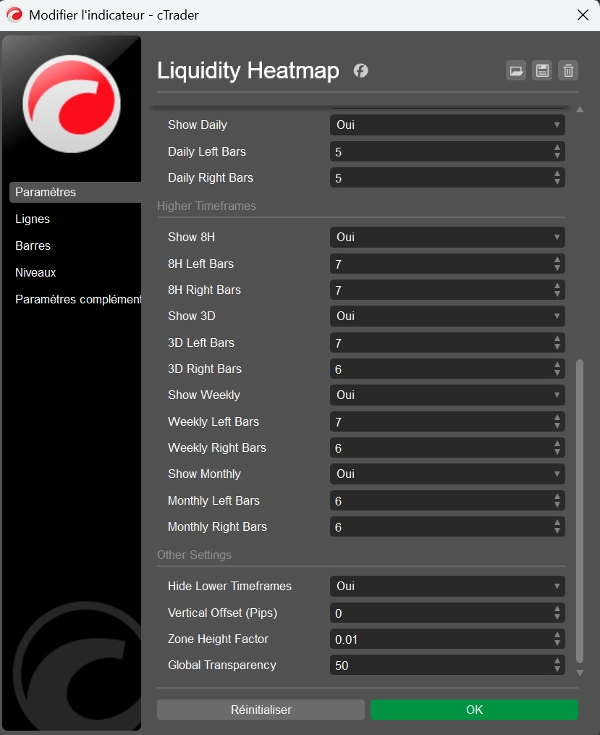
L'indicatore rileva i massimi e minimi pivot su più timeframe (15min, 30min, 1H, 2H, 4H, Daily, 8H, 3D, Weekly, Monthly) e sovrappone zone semi-trasparenti a ogni livello pivot. Dove più pivot di timeframe diversi convergono, le zone si sovrappongono e intensificano il colore, creando una "firma di calore" che rivela i livelli di liquidità più forti sul tuo grafico.
Caratteristiche Principali
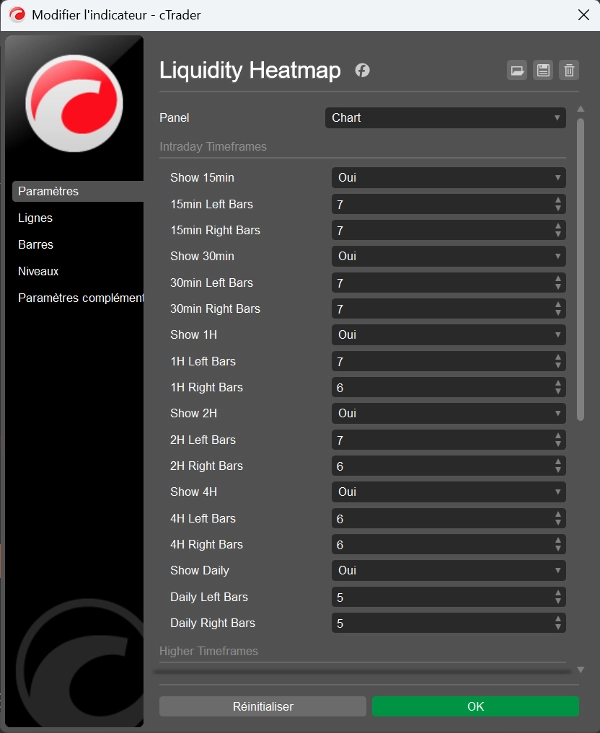
- 10 Timeframe Personalizzabili: Analizza simultaneamente da intraday (15min) a lungo termine (Mensile)
- Mappatura Intelligente della Densità: Le zone sovrapposte creano automaticamente aree più scure che mostrano la confluenza di liquidità
- Rilevamento Pivot Completamente Regolabile: Configura le barre sinistra/destra (2-20) per ogni timeframe in modo indipendente
- Visualizzazione Adattiva: L'altezza della zona si scala automaticamente con lo zoom del grafico per un aspetto coerente
- Zone Ancorate al Tempo: Le zone rimangono fissate al loro esatto momento di formazione, senza mai spostarsi sul grafico
- Trasparenza Personalizzabile: Controlla la trasparenza globale (0-255) per adattarla allo stile del tuo grafico
- Filtraggio Intelligente dei Timeframe: Opzione per nascondere i timeframe inferiori in base alla vista corrente del grafico
- Controllo dello Spostamento Verticale: Regola finemente il posizionamento della zona con un aggiustamento basato sui pip
- Codifica Colore Separata: Zone rosse per i massimi pivot (resistenza), verdi per i minimi pivot (supporto)
Perfetto Per
- Trader di Smart Money Concepts (SMC) che identificano pool di liquidità
- Seguaci della metodologia ICT che tracciano livelli istituzionali
- Trader swing che cercano zone di inversione ad alta probabilità
- Scalper che identificano rapidi afflussi di liquidità intraday
- Qualsiasi trader che cerca confluenze su più timeframe
Applicazioni di Trading
La mappa di calore rivela dove si concentrano gli stop loss e dove probabilmente si trovano gli ordini istituzionali. Usa queste zone per:
- Anticipare sweep di liquidità e inversioni
- Identificare forti confluenze di supporto/resistenza
- Trovare punti di ingresso ottimali dopo afflussi di liquidità
- Impostare stop loss strategici oltre le zone chiave di liquidità
- Confermare la validità di un breakout osservando il consumo di liquidità
Perché Questo Indicatore Si Distingue
A differenza dei semplici indicatori pivot che mostrano livelli di un singolo timeframe, questa mappa di calore aggrega dati da 10 timeframe simultaneamente, offrendo una visione completa della struttura di mercato. La visualizzazione della densità mostra immediatamente quali livelli hanno maggiore importanza - più scura è la zona, più timeframe concordano su quel livello di liquidità.
Ottimizzato per le Prestazioni
Elabora efficientemente fino a 500 barre per timeframe con una gestione intelligente degli oggetti, garantendo prestazioni fluide del grafico anche con tutti i timeframe attivati.
Facile da Configurare
Installa e inizia a fare trading immediatamente con impostazioni predefinite ottimizzate, oppure personalizza ogni parametro per adattarlo alla tua strategia e stile di trading specifici.
Eleva la tua analisi della liquidità e fai trading con l'intuizione del flusso di ordini istituzionali. Perfetto per trader che comprendono che il prezzo non si muove casualmente - si muove verso la liquidità.
Riepilogo
Key features include customizable pivot detection parameters for each timeframe, adaptive zone visualization that scales with chart zoom, and separate color coding for resistance (red) and support (green) zones. The indicator also offers adjustable transparency, vertical offset control, and smart timeframe filtering to hide lower timeframes based on the current chart view.
This tool is suitable for traders using Smart Money Concepts, ICT methodology, swing trading, scalping, or any strategy requiring multi-timeframe liquidity analysis. It helps identify clusters of stop losses and institutional orders to anticipate liquidity sweeps, reversals, strong support/resistance levels, optimal entry points, strategic stop losses, and breakout confirmations.
Liquidity Heatmap efficiently processes up to 500 bars per timeframe with optimized object management, ensuring smooth performance. It supports various markets including Forex, Crypto, Stocks, Indices, and Commodities. The indicator comes with optimized default settings and full customization options to fit different trading styles.
Recensioni dei clienti
5 | 100 % | |
4 | 0 % | |
3 | 0 % | |
2 | 0 % | |
1 | 0 % |


![Logo di "[Stellar Strategies] Smart ADX"](https://cdn.ctrader.com/image/webp/af13b084-b6f6-41db-b7bc-c7e688b57b05_36929)


