

Money Flow Profile
Indicatore
Versione 1.0, Jul 2026
Windows, Mac

534.4M
Volume negoziato
9.76M
Profitto in pip
4
Vendite
Descrizione
📊 Profilo del Flusso di Denaro
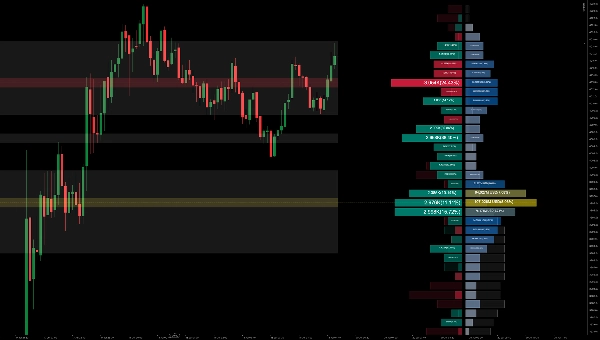
Il Profilo del Flusso di Denaro è uno strumento di grafico avanzato che misura il volume scambiato o il flusso di denaro a tutti i livelli di prezzo sul mercato in un periodo di tempo specificato. Evidenzia la relazione tra il prezzo dell'asset e la volontà dei trader di comprare o vendere, permettendoti di:
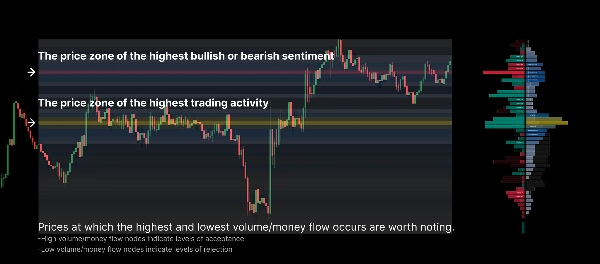
- Rivelare Livelli Chiave di Prezzo: Identificare facilmente cluster di volume e nodi ad alta liquidità come il Punto di Controllo (POC).
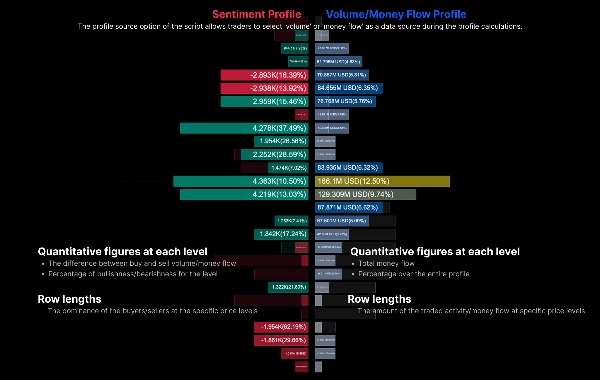
- Analizzare il Sentimento del Mercato: Visualizzando un Profilo di Sentimento a sinistra e un Profilo di Volume a destra, determina se acquirenti o venditori dominano a ciascun livello di prezzo specifico.
- Confronto tra Periodi: Confronta direttamente il profilo attuale con il profilo fantasma del periodo precedente per osservare spostamenti nel centro di gravità del mercato.
⚙️ Parametri Principali e Guida all'Uso
1. Impostazioni Generali
- Lunghezza Lookback / Intervallo Fisso: Definisce il numero di barre storiche utilizzate per calcolare il profilo (ad esempio, le ultime 200 barre).
- Fonte dei Dati:
-
1 = Volume: Calcola il profilo basandosi sul volume tradizionale di tick/scambi.2 = Flusso di Denaro: Incorpora la profondità del prezzo per calcolare la distribuzione del flusso di denaro.
2. Impostazioni del Profilo
- Risoluzione delle Righe (Righe): Determina la granularità dell'asse verticale. Un numero più alto (ad esempio, 50-100) produce un profilo più dettagliato.
- Larghezza del Profilo e Offset Orizzontale: Regola quanto è largo il profilo disegnato (in percentuale) e quanto è spostato a destra, evitando che si sovrapponga alla candela corrente.
3. Sentimento e Visualizzazione
- Polarità del Sentimento:
-
1 = Candela: Determina il sentimento rialzista/ribassista basandosi esclusivamente sull'apertura e chiusura della candela (polarità).2 = Pressione Acquisto/Vendita: Usa un calcolo più preciso considerando le ombre e la chiusura rispetto al massimo/minimo.
- Mostra Profilo Sentiment / Profilo Volume: Interruttori indipendenti per visualizzare il profilo netto del sentimento (sinistra) e il profilo principale del volume (destra).
- Mostra Periodo Precedente: Se abilitato, disegna un profilo "Ghost Bar" di sfondo che rappresenta esattamente la stessa finestra temporale del periodo precedente. Ottimo per monitorare spostamenti di supporto/resistenza.
4. Visualizzazione Area Estesa
- Mostra Heatmap: Proietta la densità del profilo su tutto il periodo di calcolo come una heatmap di sfondo. Puoi scegliere di proiettare "Volume" o "Sentimento".
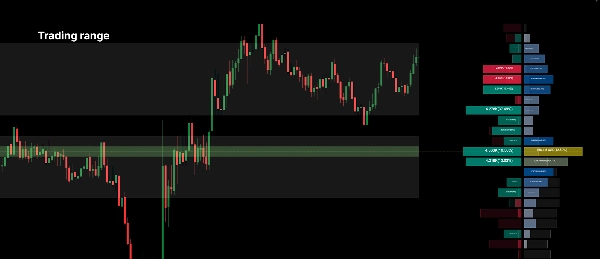
- Mostra Area di Valore: Evidenzia l'intervallo di prezzo principale dove si è verificata la maggior parte del volume di scambio. La soglia è personalizzabile (ad esempio, 70%).
- Mostra Zona POC: Disegna automaticamente una linea orizzontale e una zona al Punto di Controllo (il livello di prezzo con il volume più alto) per l'intervallo selezionato.
💡 Consigli Pratici per il Trading:
- Cerca Nodi ad Alto Volume (Picchi) per agire come forti livelli di supporto o resistenza.
- Cerca Nodi a Basso Volume (Valli), poiché il prezzo tende a muoversi rapidamente attraverso queste zone a bassa liquidità.
- Usa il Profilo Fantasma del Periodo Precedente: Se il POC attuale (linea gialla) si sta formando più in alto rispetto al POC del periodo precedente, indica che il consenso sul valore si sta spostando verso l'alto, il che è generalmente un segnale rialzista.
Riepilogo
AI summary
Money Flow Profile is an advanced indicator that maps traded volume and market sentiment across price levels over a specified time period. It visualizes the relationship between price and trader activity, highlighting key liquidity zones such as volume clusters and the Point of Control (POC). The tool displays a Sentiment Profile on the left and a Volume Profile on the right, enabling users to assess whether buyers or sellers dominate at each price level. It supports direct comparison with the previous period’s profile via a ghost overlay to track shifts in market value consensus.
Core configurable parameters include lookback length, data source selection (volume or money flow), row resolution for vertical granularity, profile width and offset, and sentiment polarity calculation methods (candle-based or buy/sell pressure). Display options allow toggling of sentiment and volume profiles, previous period overlays, heatmaps of volume or sentiment density, value area highlighting, and automatic POC zone marking.
The indicator is designed to help identify strong support and resistance levels at high volume nodes and anticipate rapid price movements through low volume nodes. It supports detailed volume and sentiment analysis to inform trading decisions based on liquidity and market structure.
Core configurable parameters include lookback length, data source selection (volume or money flow), row resolution for vertical granularity, profile width and offset, and sentiment polarity calculation methods (candle-based or buy/sell pressure). Display options allow toggling of sentiment and volume profiles, previous period overlays, heatmaps of volume or sentiment density, value area highlighting, and automatic POC zone marking.
The indicator is designed to help identify strong support and resistance levels at high volume nodes and anticipate rapid price movements through low volume nodes. It supports detailed volume and sentiment analysis to inform trading decisions based on liquidity and market structure.
Profilo indicatore
Categoria indicatore
Volume
Tipo di output
Visualizzazione
Requisiti per i dati
Volume
DoM
Solo barre
Dati sui tick
Segnali supportati
Rottura
Forza del trend
Inversione
Volatilità
Livello raggiunto
Livello rotto
Recensioni dei clienti
0.0
Recensioni: 0
Recensioni dei clienti
Questo prodotto non ha ancora ricevuto recensioni. L'hai già provato? Fallo sapere agli altri per primo!
Discussioni
Domande frequenti
Key Levels
Volume
I prodotti disponibili tramite cTrader Store, inclusi bot di trading, indicatori e plugin, sono forniti da sviluppatori terzi e resi disponibili esclusivamente a scopo informativo e di accesso tecnico. cTrader Store non è un broker e non fornisce consulenze in materia di investimento, raccomandazioni individualizzate o garanzie di risultati futuri.
Altro da questo autore





















Prezzo
534.4M
Volume negoziato
9.76M
Profitto in pip
4
Vendite