
Volume Profile Pro
インジケーター
8 購入済
バージョン 1.0、Oct 2025
Windows、Mac
5.0
レビュー: 3
説明
Volume Profile Pro は、正確な市場構造と流動性のマッピングのために設計されたプロフェッショナルな固定範囲のボリューム分析ツールです。
定義されたチャート範囲内の各価格レベルでどれだけの取引活動があったかを視覚化できるため、高ボリュームノード、コントロールポイント(POC)、および70%のバリューエリアなどの関心ゾーンを瞬時に特定するのに役立ちます。
主な特徴
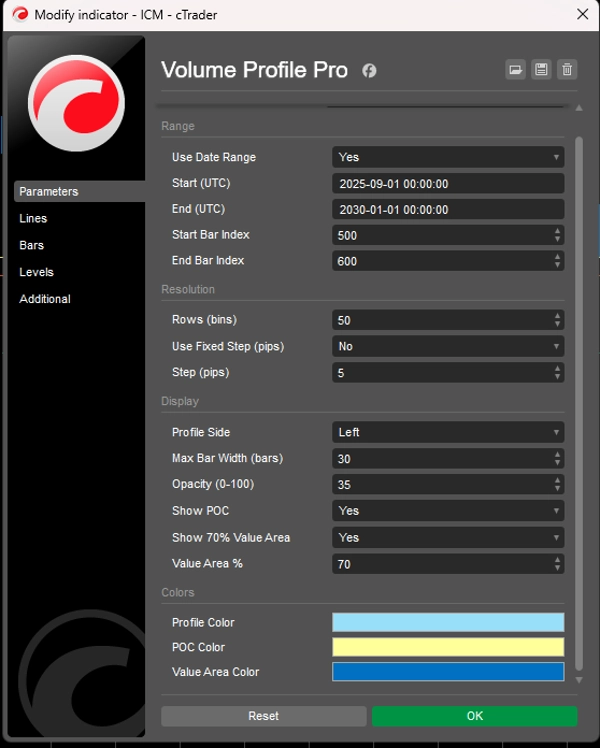
- 🧭 固定範囲選択 – 日付またはバーインデックスでカスタム範囲を定義し、関心のある領域のみを分析します。
- 📊 正確なボリューム分布 – 選択した範囲のティックボリュームからボリュームヒストグラムを作成します。
- 🎯 POCとバリューエリア – コントロールポイントと70%のバリューエリアバンドを自動的にハイライトします。
- ⚙️ 柔軟な解像度 – カスタム粒度のために調整可能なビン数または固定ピップステップ。
- 🎨 クリーンな視覚化 – 最適なチャートの読みやすさのために、サイド(左/右)、幅のスケーリング、透明度を選択できます。
- ⚡ 軽量かつ最適化 – ターミナルの動作を遅くすることなくリアルタイムのボリューム分析を効率的に計算します。
使い方
- 使用する範囲として 日付範囲 または バーインデックス範囲 を選択します。
- 開始/終了のパラメータを定義します。
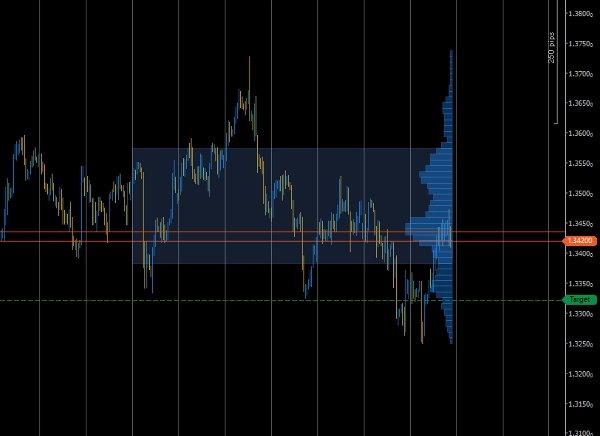
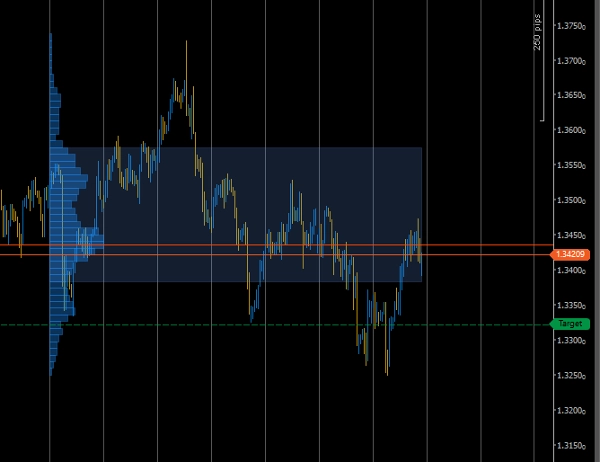
- インジケーターは各価格ステップでのティックボリュームを計算し、相対的な活動を示す水平バーをプロットします。
- 最も長いバーが POC を示し、薄く色付けされた領域が バリューエリア(デフォルトは70%)を表示します。
こんな方に最適
- 流動性の集中を分析する日中およびスイングトレーダー。
- データ駆動型のゾーンを求めるボリュームベースの戦略開発者。
- POCまたはバリューエリアの反転/コンフルエンスレベルを使用するトレーダー。
概要
AIによる概要
Volume Profile Pro is a fixed-range volume analysis indicator designed to visualize trading volume distribution by price within a user-defined chart range. It calculates tick volume at each price level and displays a horizontal histogram that highlights key market structure elements such as the Point of Control (POC)—the price with the highest traded volume—and the 70% Value Area, representing the price range where most trading activity occurred. Users can select the analysis range by date or bar index and adjust the resolution through customizable bin counts or fixed pip steps. The indicator offers flexible visualization options, including side placement, width scaling, and opacity adjustments, to enhance chart readability. Its efficient computation supports real-time volume studies without impacting terminal performance. Volume Profile Pro is suitable for intraday and swing traders, volume-based strategy developers, and those utilizing POC or Value Area levels for trading decisions. It supports multiple markets and symbols, including Forex pairs (EURUSD, GBPUSD, NZDUSD, USDJPY), cryptocurrencies (BTCUSD), commodities (XAUUSD), indices (NAS100), and stocks.
インジケーターのプロフィール
カスタマーレビュー
5.0
レビュー: 3
5 | 100 % | |
4 | 0 % | |
3 | 0 % | |
2 | 0 % | |
1 | 0 % |
カスタマーレビュー
October 20, 2025
Practical market note if the trader wants it adds useful information behind the price move. It works best as support, not a final decision maker. Volume context is stronger when POC, VWAP and value area agree across 2 sessions. volume alone can be noisy without price action.
October 19, 2025
October 19, 2025
Focused demo option for traders who want confirmation beyond candles. It gives value around volume based context, but volume alone can be noisy without price action. I would review 20 reactions near POC or VWAP before trusting the read. The data helps most when price action confirms the same zone.
ディスカッション
よくあるご質問
BTCUSD
Prop
Forex
Indices
Commodities
Crypto
Stocks
cTrader Storeで入手可能な取引ボット、インジケーター、プラグインなどの商品は、第三者の開発者が提供するものであり、情報と技術の取得のみを目的としてご利用いただけます。cTrader Storeはブローカーではなく、投資助言や個人的な推奨を行うことも、将来のパフォーマンスを保証することもありません。


これも好きかも


価格
登録日 31/10/2024
56
販売
1.75K
無料インストール