
説明
ヒートマップ流動性ゾーン
価格ごとの出来高を視覚化し、隠れたサポート/レジスタンスを発見し、市場の流動性をリアルタイムで追跡します。
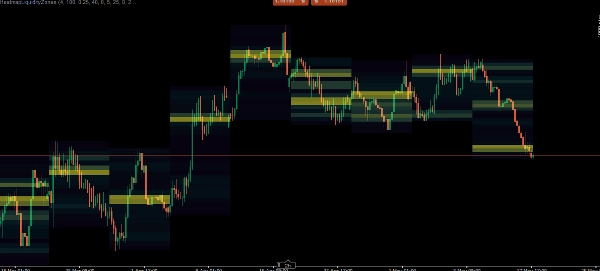
ヒートマップ流動性ゾーンインジケーターは、生の市場データを直感的なビジュアルヒートマップに変換する強力なボリュームプロファイリングツールです。特定の高時間足(HTF)にわたるティックボリュームを分析することで、最も重要な買い圧力と売り圧力が集中している正確な場所を特定します。
市場がどこで反転するかを推測する代わりに、このインジケーターは正確でボリュームに裏付けられた流動性レベルをプロットします。これらのレベルは動的に前方へ延長され、価格がこれらを突破して無効化すると自動的に消え、チャートをクリーンかつ現在の価格アクションに厳密に関連した状態に保ちます。
主な特徴
マルチタイムフレームヒートマップ:お好みのマクロ時間足(1時間、4時間、日足、週足、または月足)を選択できます。インジケーターはその特定期間の出来高分布を直接下位時間足のチャートにマッピングします。
動的ATRビニング:価格スケールは平均真の範囲(ATR)を用いて計算された動的な「ビン」(ゾーン)に分割されます。これにより、ヒートマップは非常にボラティリティが高い市場や緊密に統合された市場の両方に賢く適応します。
自動無効化される流動性レベル:特定の価格ビンに大量の出来高が蓄積されると、それは「流動性レベル」となります。インジケーターは未来に向かって延長される実線を描きます。価格がこのレベルを突破すると、その線は自動的に削除(無効化)されます。
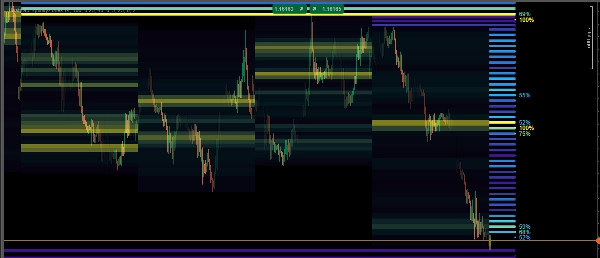
密度グラデーションカラーリング:低、中、高の出来高ノードを視覚的に区別します。ヒートマップは色のグラデーションを使用して、最も重い出来高がどこに閉じ込められているかを正確に示します。
パーセンテージ追跡:高密度の流動性レベルはパーセンテージラベル(例:85%)を表示し、そのノードがHTF期間の他の出来高に対してどれほど強いかを正確に示します。
概要
The indicator segments the price scale into dynamic zones based on the Average True Range (ATR), adapting to market volatility. It highlights significant volume clusters as liquidity levels with solid lines extending forward. These lines automatically disappear if the price breaks through the level, ensuring the chart remains focused on relevant, current price action.
A color gradient visually distinguishes low, medium, and high volume nodes, while percentage labels indicate the relative strength of high-density liquidity levels within the chosen timeframe. This tool supports traders in tracking market liquidity in real-time and making volume-backed decisions regarding support and resistance areas.
カスタマーレビュー
5 | 100 % | |
4 | 0 % | |
3 | 0 % | |
2 | 0 % | |
1 | 0 % |


