
True Trend H4
Wskaźnik
2 zakupy
Wersja 1.0, Jun 2025
Windows, Mac
4.0
Opinie: 1
Opis
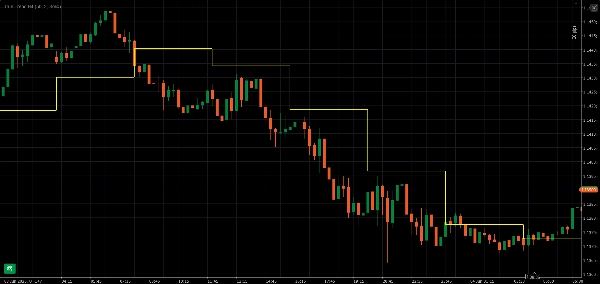
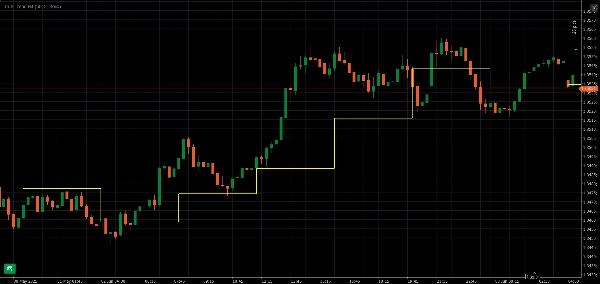
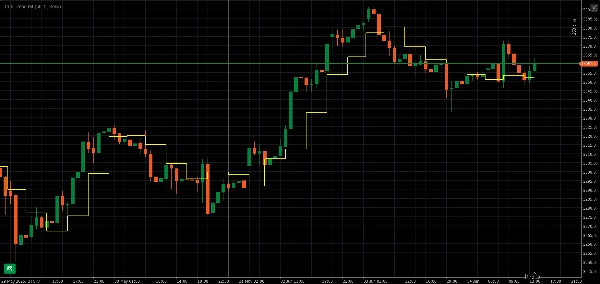
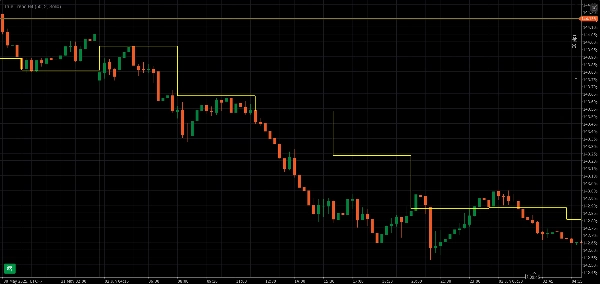
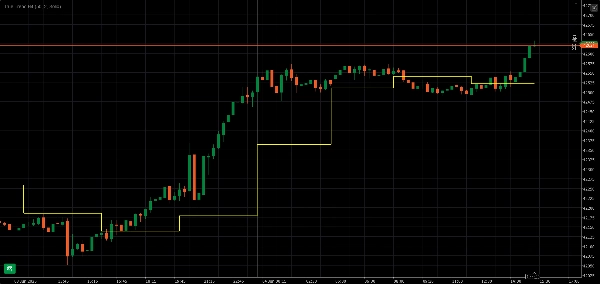
Wskaźnik True Trend H4 wykorzystuje linię schodkową, aby zapewnić wyraźne poczucie kierunku trendu H4. Można to bardzo dobrze zobaczyć na mniejszych ramach czasowych, takich jak M1, M5, M15, M30 i H1.
Podsumowanie
Profil wskaźnika
Opinie klientów
4.0
Opinie: 1
5 | 0 % | |
4 | 100 % | |
3 | 0 % | |
2 | 0 % | |
1 | 0 % |
Opinie klientów
June 7, 2025
The signal still needs a chart check, no surprise there. A 5 minute check should not become a 30 minute rabbit hole.
Dyskusja
Częste pytania
Produkty dostępne za pośrednictwem cTrader Store, w tym boty handlowe, wskaźniki i wtyczki, dostarczane są przez deweloperów zewnętrznych i udostępniane wyłącznie w celach informacyjnych oraz w celu zapewnienia dostępu technicznego. cTrader Store nie jest brokerem i nie zapewnia doradztwa inwestycyjnego, nie udziela spersonalizowanych rekomendacji ani nie gwarantuje przyszłych wyników.


Cena
Od 28/05/2025
69.33M
Wolumen transakcji
391.46K
Zysk w pipsach
2
Sprzedaż