
Opis
Zaawansowany Pro Profil Wolumenu: Instytucjonalny Stały Zakres & Przepływ Zleceń
Ulepsz swoją analizę rynku dzięki Zaawansowanemu Pro Profilowi Wolumenu, wysoce zoptymalizowanemu wskaźnikowi klasy instytucjonalnej zaprojektowanemu dla traderów. Stworzony dla day traderów, skalperów i swing traderów, którzy opierają się na Teorii Aukcji Rynkowej, to narzędzie wprowadza precyzję do Dystrybucji Wolumenu, Obszarów Wartości oraz dynamiki Przepływu Zleceń.
W przeciwieństwie do standardowych profili wolumenu detalicznego, które stale się przeliczają, przesuwają lub zrywają podczas powiększania i pomniejszania, ten wskaźnik wprowadza Tryb Prawdziwego Kotwicy (Stały Zakres) z zachowaniem pamięci, czyniąc go ostatecznym narzędziem do handlu na żywo i rygorystycznej analizy historycznej.
🔥 Główne Funkcje & Przewaga w Handlu
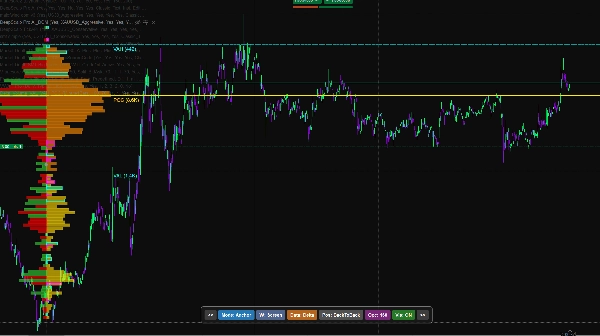
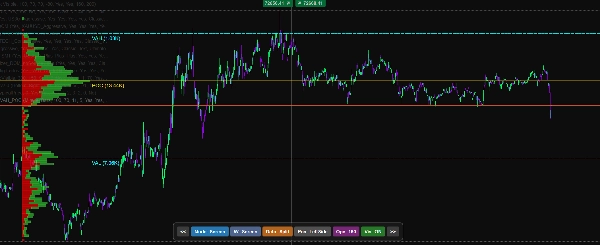
1. Tryb Prawdziwego Kotwicy (Idealny do analizy historycznej)
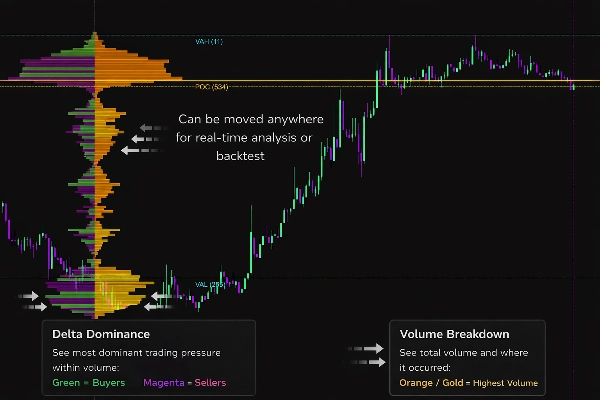
Przestań walczyć z przesuwającymi się profilami! Dzięki naszemu Trybowi Kotwicy możesz umieścić dwie interaktywne pionowe linie w dowolnym miejscu na wykresie, aby analizować konkretny ruch, sesję lub strefę konsolidacji.
- Brak Zniekształceń: Powiększaj, pomniejszaj lub przewijaj — profil pozostaje matematycznie przypięty do wybranych punktów kotwicy.
- Analiza historyczna: Przewijaj miesiące lub lata wstecz, przypnij profil do przeszłego wydarzenia rynkowego i analizuj dokładną dystrybucję wolumenu oraz Punkt Kontroli (POC) tak, jak miało to miejsce. Kotwice zapamiętują swoje dokładne pozycje, pozwalając na bezbłędne badanie przeszłych ustawień bez resetowania siatki.
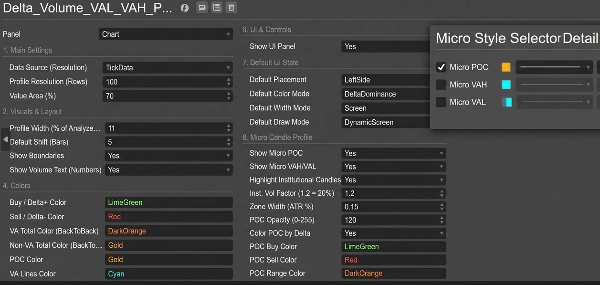
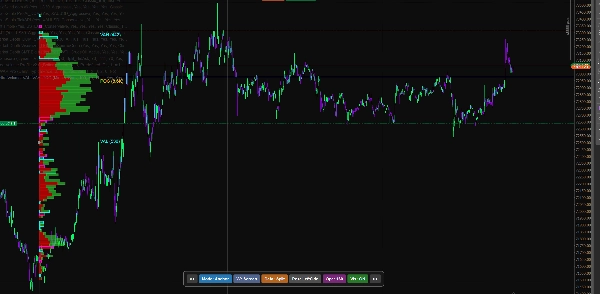
2. Interaktywny Panel UI na Wykresie
Nie musisz ciągle otwierać ustawień wskaźnika. Elegancki, nieinwazyjny panel UI na dole wykresu pozwala na:
- Przełączanie między Trybem Ekranu (Dynamiczny) a Trybem Kotwicy (Stały Zakres) jednym kliknięciem.
- Przesuwanie pozycji profilu (Lewo, Prawo, Back-to-Back).
- Regulowanie szerokości wizualnej i przezroczystości na bieżąco.
- Przełączanie między Podziałem Kupna/Sprzedaży a Dominacją Delty w kolorowaniu wolumenu.
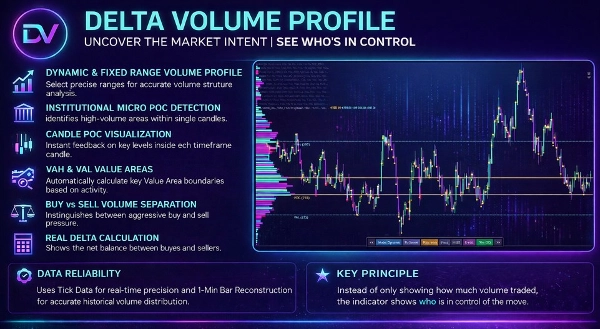
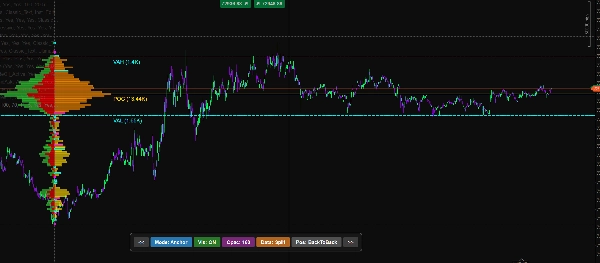
3. Głębokie Wglądy w Przepływ Zleceń
Czytaj mikrostrukturę rynku jak profesjonalista:
- Dominacja Delty & Podział: Wizualizuj agresywne kupno rynkowe kontra sprzedaż rynkowa w każdej nodzie cenowej.
- Nierównowagi Wolumenu: Automatycznie wykrywaj i podświetlaj ogromne nierównowagi kupna/sprzedaży (dostosowywalny współczynnik, np. 300% dominacji), aby dostrzec instytucjonalną absorpcję lub agresywne wybicia.
- Wykrywanie HVN & LVN: Wyraźnie identyfikuje Węzły Wysokiego Wolumenu (magnesy dla ceny) oraz Węzły Niskiego Wolumenu (pustki płynności, gdzie cena porusza się szybko).
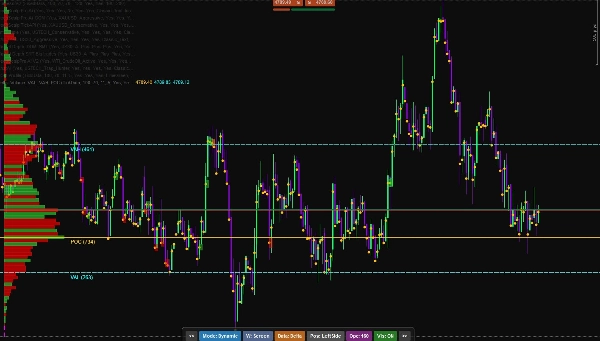
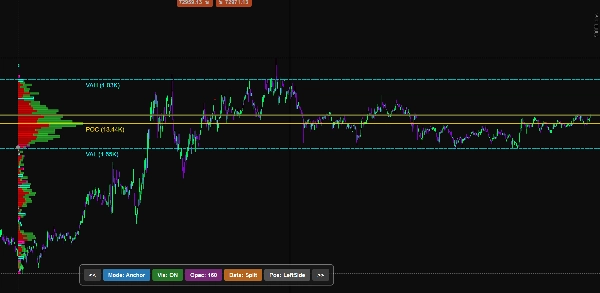
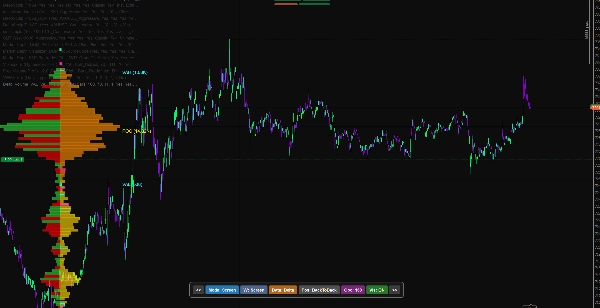
4. Dynamiczny Obszar Wartości & Nagły POC
- Wyświetla precyzyjne Wysoki Obszar Wartości (VAH) i Niski Obszar Wartości (VAL) oparte na odchyleniach standardowych (domyślnie 70%).
- Podkreśla Punkt Kontroli (POC).
- Rozszerz Nagły POC: Automatycznie rozszerza niezweryfikowane linie POC w przyszłość, dostarczając wysoce reaktywne cele wsparcia i oporu.
5. Wysoce Zoptymalizowany
- Źródła Danych: Wybierz między hiperprecyzyjnymi danymi Tick lub lekkimi danymi z 1-minutowych świec do długoterminowej analizy historycznej.
- Inteligentne Renderowanie: Zaprojektowany, aby obsługiwać ogromne ilości danych bez zawieszania platformy.
🛠️ Jak go używać do nauki, gdy nie handlujesz:
- Przewiń do wybranej daty na wykresie.
- Kliknij "Tryb: Kotwica" na panelu UI.
- Przeciągnij dwie pionowe przerywane linie, aby objąć dokładny ruch cenowy lub sesję handlową, którą chcesz analizować.
- Profil Wolumenu generuje się natychmiast. Możesz powiększyć wykres minutowy, aby sprawdzić dokładne punkty wejścia, nierównowagi i ponowne testy Obszaru Wartości bez utraty pozycji profilu!
Przejmij kontrolę nad swoimi wykresami. Przestań handlować wzorcami detalicznymi i zacznij handlować wolumenem instytucjonalnym.
Podsumowanie
An interactive on-chart UI panel enables quick toggling between dynamic Screen Mode and fixed Anchor Mode, profile position adjustments, visual customization, and switching between Buy/Sell Split and Delta Dominance volume coloring. The tool offers deep order flow insights, including visualization of aggressive buying versus selling, automatic detection of volume imbalances, and identification of High Volume Nodes (HVN) and Low Volume Nodes (LVN).
It displays dynamic Value Area High (VAH), Value Area Low (VAL), and Point of Control (POC) lines, with an option to extend naked POC lines as future support/resistance targets. Users can select data sources between tick data and 1-minute bars for optimized performance and historical analysis. The indicator is engineered for efficient rendering to handle large datasets without platform lag.
Opinie klientów
5 | 50 % | |
4 | 50 % | |
3 | 0 % | |
2 | 0 % | |
1 | 0 % |


