Penerangan
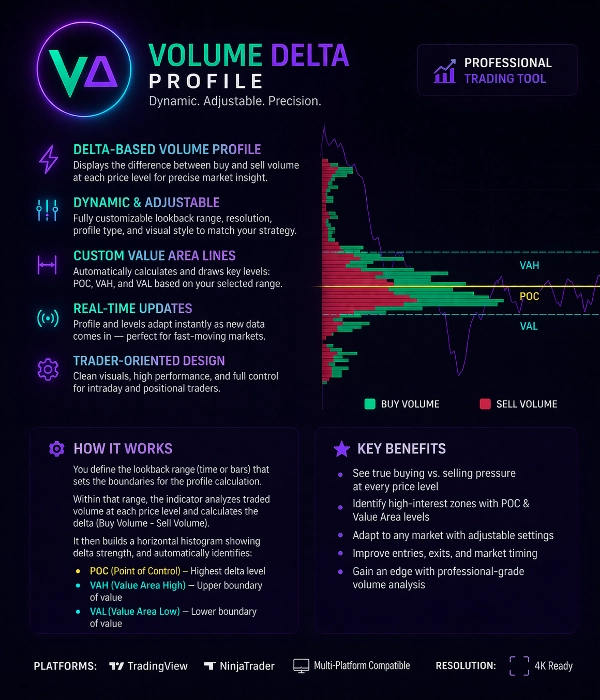
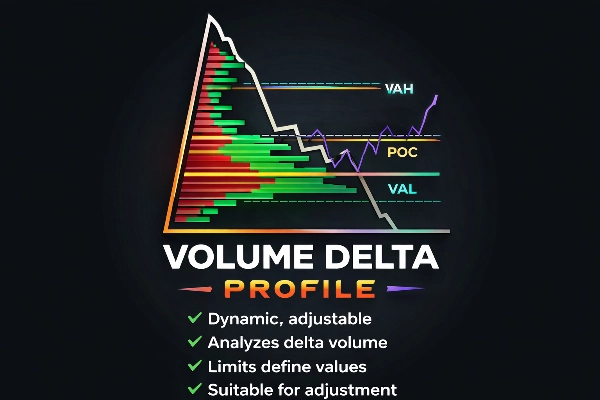
Profil Delta Isipadu
Wawasan Aliran Pesanan Profesional untuk Pedagang Lanjutan
Profil Delta Isipadu adalah alat dagangan yang kuat yang direka untuk mendedahkan imbangan sebenar antara pembeli dan penjual pada setiap tahap harga.
Tidak seperti profil isipadu tradisional, penunjuk ini menganalisis Isipadu Delta (Isipadu Beli – Isipadu Jual) untuk menunjukkan di mana peserta pasaran agresif menguasai.
Ia membantu pedagang mengenal pasti aktiviti institusi, zon penyerapan, dan tahap harga yang menarik minat tinggi dengan ketepatan.
Ciri Utama
Profil Isipadu Berasaskan Delta
Penunjuk mengira delta isipadu pada setiap tahap harga, memisahkan:
• Tekanan pembelian agresif
• Tekanan penjualan agresif
Ini mendedahkan siapa yang sebenarnya mengawal pasaran.
Julat Profil Dinamik & Boleh Laras
Julat pengiraan profil adalah boleh disesuaikan sepenuhnya.
Pengguna boleh menentukan kawasan pengiraan dengan:
• Julat bar tersuai
• Julat sesi
• Pemilihan manual
• Julat dinamik bergulung
Profil secara automatik mengemas kini apabila data baru tiba.
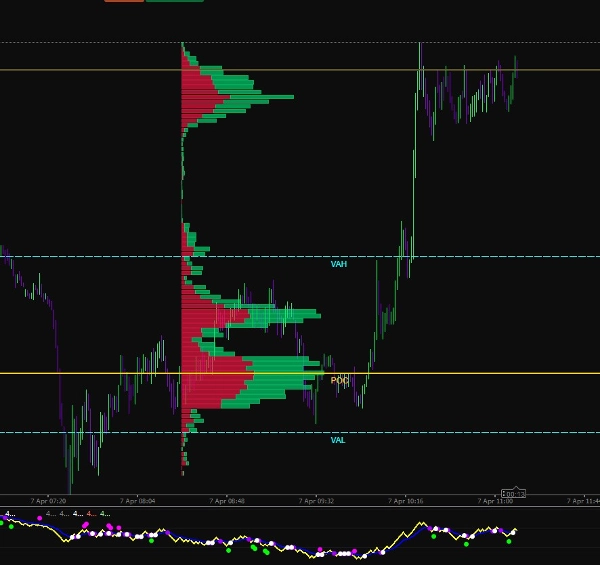
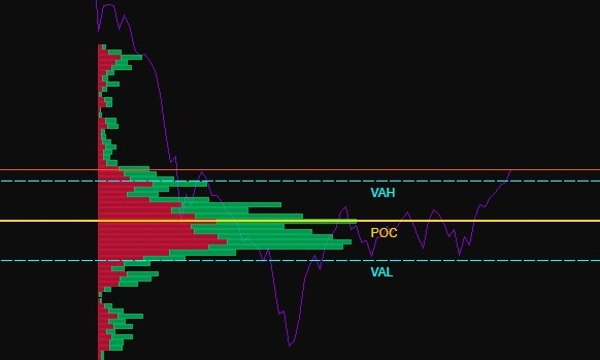
Pengesanan Kawasan Nilai
Penunjuk secara automatik mengira tahap struktur pasaran utama:
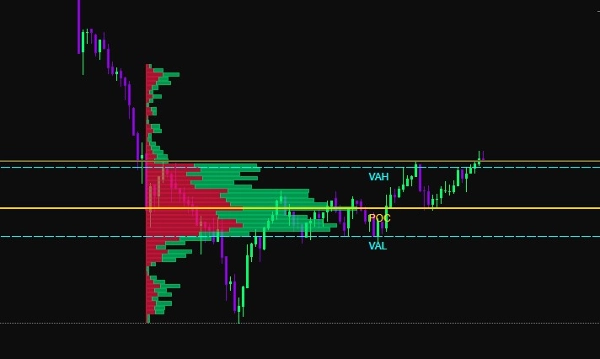
POC (Titik Kawalan)
Tahap harga dengan isipadu delta dagangan tertinggi.
VAH (Nilai Kawasan Tinggi)
Sempadan atas kawasan nilai.
VAL (Nilai Kawasan Rendah)
Sempadan bawah kawasan nilai.
Tahap-tahap ini menyerlahkan di mana majoriti aktiviti pasaran berlaku.
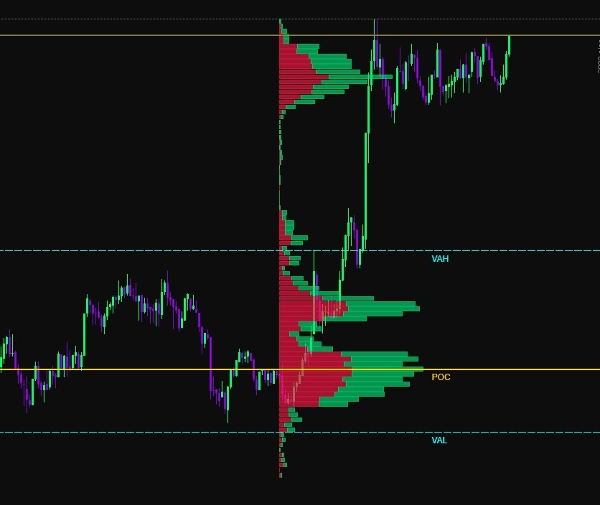
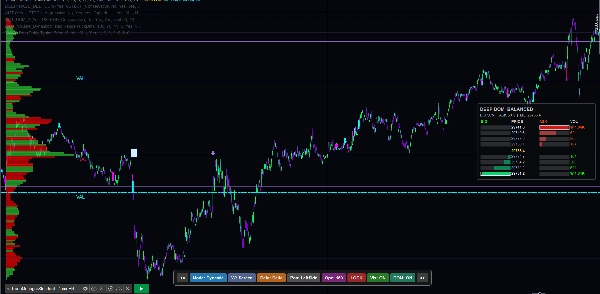
Visualisasi Beli vs Jual
Isipadu dipaparkan sebagai histogram mendatar:
Bar hijau → Isipadu Beli Dominan
Bar merah → Isipadu Jual Dominan
Ini membolehkan pedagang melihat dengan segera:
• Zon penyerapan
• Kawasan ketidakseimbangan
• Kumpulan kecairan
• Jejak institusi
Visualisasi Adaptif
Penunjuk termasuk pelbagai pilihan penyesuaian visual:
• Lebar histogram boleh laras
• Skema warna tersuai
• Ketelusan boleh laras
• Kawalan resolusi
• Rendering adaptif zum
Ini memastikan visualisasi yang jelas pada semua jangka masa carta.
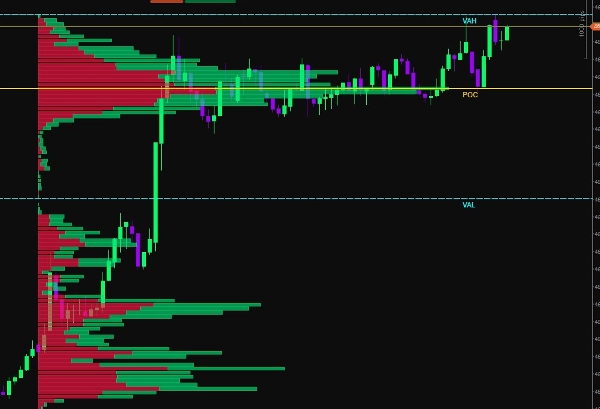
Tahap Sempadan Pintar
Penunjuk melukis tahap rujukan dinamik:
• Garis POC
• Garis VAH
• Garis VAL
Tahap-tahap ini dikemas kini secara automatik berdasarkan julat profil yang dipilih dan boleh digunakan sebagai:
• Sokongan / Rintangan
• Zon pembalikan purata
• Tahap pengesahan pecahan
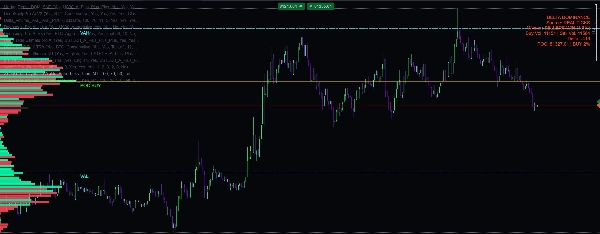
Pengiraan Masa Nyata
Profil Delta Isipadu sentiasa mengira semula menggunakan data pasaran langsung.
Ini memastikan pedagang sentiasa melihat maklumat aliran pesanan terkini semasa pasaran pantas.
Kes Penggunaan
Alat ini sesuai untuk:
• Scalping
• Dagangan intrahari
• Dagangan niaga hadapan
• Analisis aliran pesanan
• Penjejakan kecairan
• Pengesanan jejak institusi
Kelebihan Dagangan Utama
✔ Kenal pasti tekanan beli vs jual sebenar
✔ Mengesan zon penyerapan dan keletihan
✔ Cari tahap kecairan tinggi
✔ Tingkatkan ketepatan kemasukan
✔ Sahkan pecahan atau pembalikan
✔ Fahami struktur pasaran
Spesifikasi Teknikal
Kaedah Pengiraan:
Isipadu Delta = Isipadu Beli − Isipadu Jual
Jenis Profil:
Histogram Tahap Harga Mendatar
Tahap Automatik:
POC, VAH, VAL
Mod Kemas Kini:
Kemas Kini Dinamik Masa Nyata
Tetapan Tersuai:
• Julat Profil
• Resolusi Histogram
• Skala Isipadu
• Tetapan Warna
• Kebolehlihatan Tahap
Keserasian Platform:
Dioptimumkan untuk render carta berprestasi tinggi
Direka untuk Pedagang Profesional
Profil Delta Isipadu dibina untuk pedagang yang ingin bergerak melebihi penunjuk asas dan memahami mekanik sebenar pasaran.
Dengan menggabungkan analisis isipadu, pengiraan delta, dan struktur kawasan nilai, alat ini menyediakan pandangan jelas tentang penyertaan pasaran dan pengagihan kecairan.
Ringkasan
Users can customize the profile calculation range using options such as custom bar range, session range, manual selection, or rolling dynamic range, with real-time updates as new market data arrives. Key market structure levels—Point of Control (POC), Value Area High (VAH), and Value Area Low (VAL)—are automatically calculated and drawn as dynamic reference lines, useful for support/resistance, mean reversion, and breakout confirmation.
Additional features include adjustable histogram width, color schemes, transparency, resolution control, and zoom-adaptive rendering for clear visualization across all chart timeframes. The tool supports use cases like scalping, intraday trading, futures trading, order flow analysis, liquidity tracking, and institutional footprint detection. It is optimized for high-performance chart rendering and aims to provide traders with precise insights into market participation and liquidity distribution.