
Descrizione
CVD ai
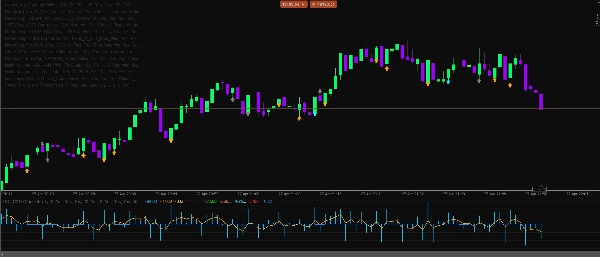
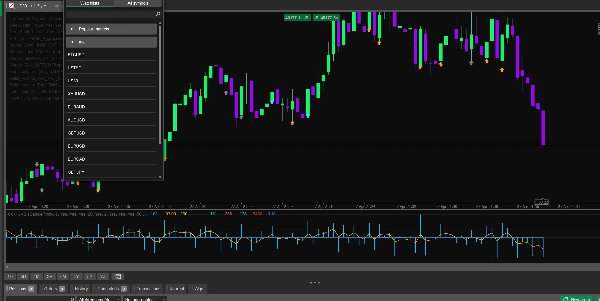
Delta CVD Advanced è un indicatore professionale di analisi del momentum e degli ordini progettato per i trader che desiderano una visione più chiara della pressione di acquisto e vendita direttamente dal comportamento del mercato. Combina Delta, CVD, momentum tick live, assorbimento, divergenza, filtri di sessione, guardie di volatilità e un motore di confluenza intelligente in un unico strumento analitico pulito.
Questo indicatore è costruito per lo scalping, il trading intraday e la conferma del momentum a breve termine su Forex, Oro, Indici, Cripto e mercati del Petrolio.
Caratteristiche principali
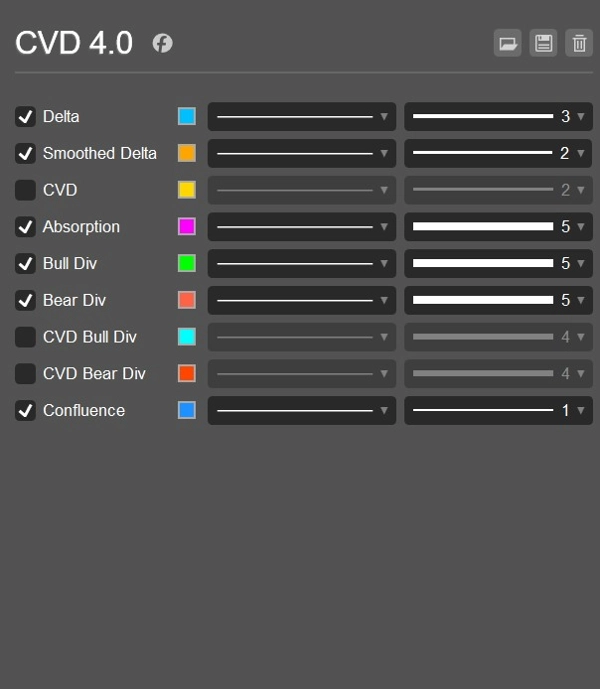
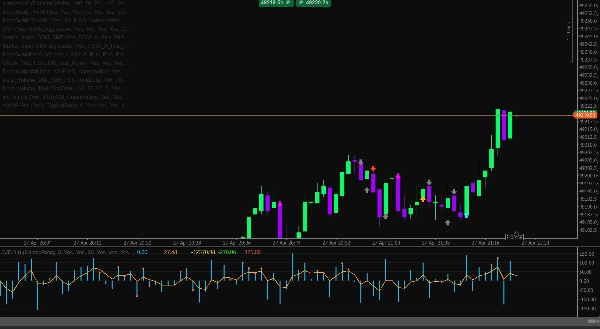
- Calcolo Delta live utilizzando la logica uptick/downtick
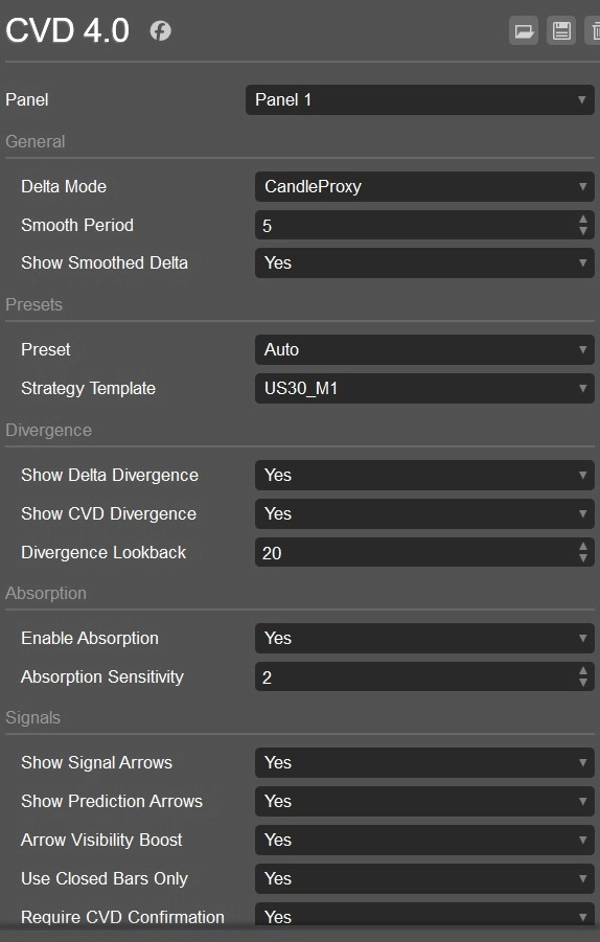
- Modalità delta proxy candela per analisi storica
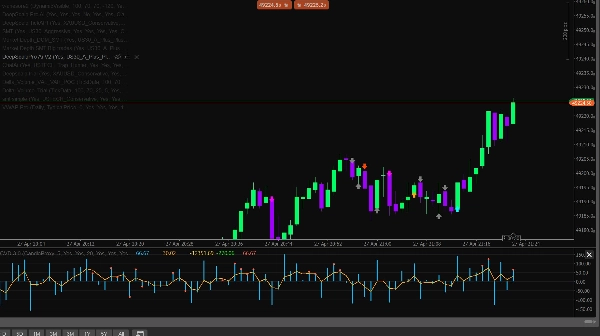
- Linea Cumulative Volume Delta per tracciare la pressione nel tempo
- Linea Delta smussata per una lettura del momentum più pulita
- Istogramma Delta colorato per acquisto/vendita
- Calcolo del momentum basato sui tick per l'impulso di mercato live
- Modalità momentum ibrida che combina pendenza CVD e impulso tick
- Opzioni di reset CVD: Mai, Giornaliero o per Sessione
- Rilevamento divergenza Delta rialzista e ribassista
- Rilevamento divergenza CVD rialzista e ribassista
- Rilevamento assorbimento per individuare pressione che non muove il prezzo
- Frecce segnale per opportunità di ACQUISTO e VENDITA
- Frecce di previsione per avvisi precoci di cambiamento di momentum
- Conferma CVD opzionale per i segnali
- Motore di confluenza intelligente con punteggio direzionale
- Filtro pressione proxy DOM
- Filtro rilevamento sweep per acquisizioni di liquidità
- Filtri di sessione per Asia, Londra e New York
- Rilevamento automatico della sessione usando l'ora UTC
- Guardia di volatilità usando limiti ATR
- Guardia spread per evitare condizioni di mercato sfavorevoli
- Filtro rapporto volume per evitare segnali deboli a basso volume
- Preset simboli per Forex, Oro, Indici, Cripto e Petrolio
- Template strategici per US30 M1, USTECH M1, XAUUSD M1, BTCUSD M1 e Oil M1
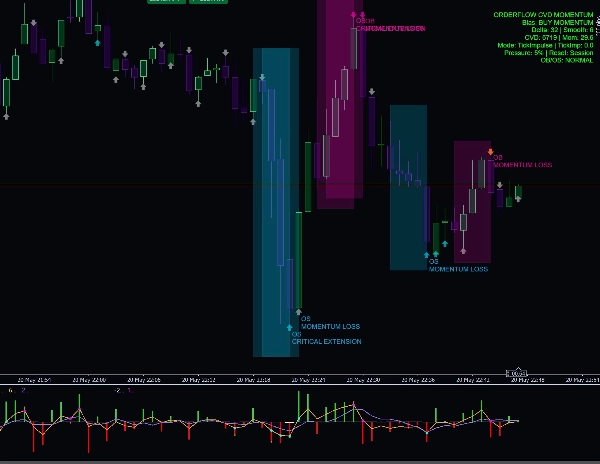
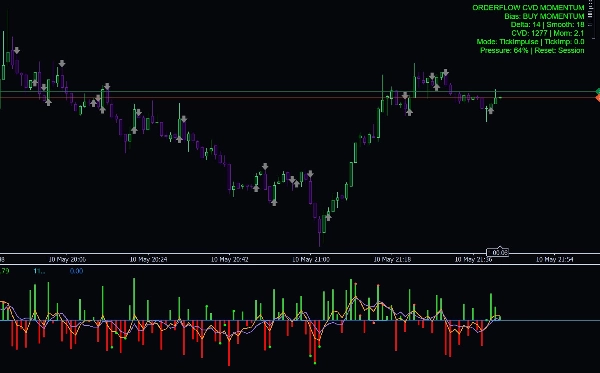
- Dashboard informativa che mostra bias, Delta, Delta smussato, CVD, Momentum, percentuale di pressione e modalità di reset
- Avvisi log opzionali con controllo cooldown
Perché i trader lo usano
Delta CVD Advanced aiuta i trader a capire chi è attualmente al controllo: acquirenti o venditori. Invece di affidarsi solo alle candele di prezzo, l'indicatore analizza la pressione dietro il movimento. Questo lo rende utile per confermare gli ingressi, evitare segnali deboli, identificare inversioni, individuare assorbimenti e rilevare cambiamenti di momentum prima che diventino evidenti sul prezzo.
La modalità momentum tick è particolarmente utile per lo scalping live perché reagisce agli impulsi di prezzo in tempo reale, mentre gli strumenti CVD e delta smussato aiutano a confermare se il movimento ha una reale forza dietro di sé.
Migliore utilizzo per
- Scalping
- Trading intraday
- Conferma del momentum
- Conferma di inversione
- Analisi sweep di liquidità
- Trading con divergenze Delta e CVD
- Oro, Indici, Cripto, Petrolio e coppie Forex
- M1, M5 e altri timeframe inferiori
Avviso importante
Questo indicatore è uno strumento analitico di supporto alle decisioni. Non garantisce profitti e dovrebbe essere utilizzato insieme a una corretta gestione del rischio, struttura di mercato e un piano di trading testato.
Riepilogo
Recensioni dei clienti
5 | 0 % | |
4 | 100 % | |
3 | 0 % | |
2 | 0 % | |
1 | 0 % |


