
HTFBB
Indicatore
1 acquisti
Versione 1.0, Jul 2025
Windows, Mac
5.0
Recensioni: 1
Descrizione
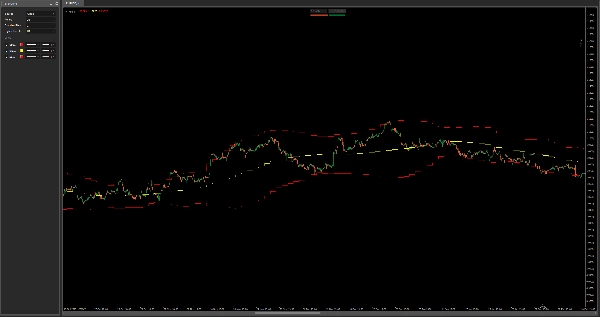
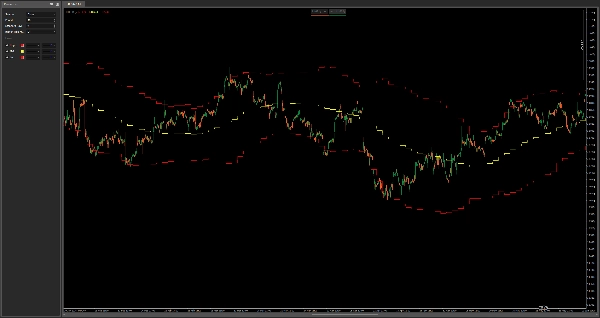
HTF Bollinger Bands – Mappa della volatilità multi-temporale
Questo indicatore traccia le Bande di Bollinger da un timeframe superiore sul tuo grafico attuale, offrendoti un potente contesto per la volatilità, la reversione alla media e il supporto/resistenza dinamico—tutto senza cambiare timeframe.
Caratteristiche:
- Visualizza le Bande di Bollinger superiore, centrale e inferiore da qualsiasi timeframe superiore selezionabile
- Ottimo per individuare zone di consolidamento HTF, pressione di breakout, e ritracciamenti di trend
- Ideale per scalping e ingressi intraday con consapevolezza del timeframe superiore
- Funziona su tutti gli asset e timeframe
Combina con la tua strategia attuale per evitare di operare in trappole di volatilità e rimanere allineato con la struttura macro del prezzo.
Riepilogo
Profilo indicatore
Recensioni dei clienti
5.0
Recensioni: 1
5 | 100 % | |
4 | 0 % | |
3 | 0 % | |
2 | 0 % | |
1 | 0 % |
Recensioni dei clienti
July 29, 2025
confusing signals get easier to ignore, but a clean signal can still fail.
Discussioni
Domande frequenti
I prodotti disponibili tramite cTrader Store, inclusi bot di trading, indicatori e plugin, sono forniti da sviluppatori terzi e resi disponibili esclusivamente a scopo informativo e di accesso tecnico. cTrader Store non è un broker e non fornisce consulenze in materia di investimento, raccomandazioni individualizzate o garanzie di risultati futuri.


Prezzo
Da 03/01/2025
638.03K
Volume negoziato
21.34K
Profitto in pip
15
Vendite