
Descrizione
Supertrend Channels è un indicatore sovrapposto personalizzato progettato per aiutare i trader a identificare visivamente zone dinamiche di supporto e resistenza, segnali di ingresso e livelli di trailing stop-loss utilizzando una logica basata sull'ATR.
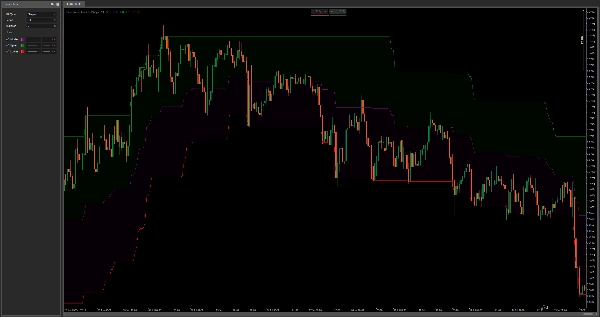
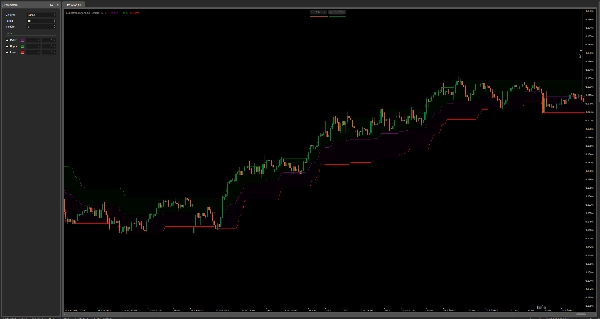
L'indicatore traccia tre linee:
- Upper Band (Verde) – funge da resistenza dinamica o trailing stop-loss per operazioni long.
- Lower Band (Rosso) – funge da supporto dinamico o trailing stop-loss per operazioni short.
- Middle Line (Viola) – serve come livello di ritorno alla media o potenziale punto di ingresso.
Calcola le bande utilizzando l'Average True Range (ATR) moltiplicato per un fattore definito dall'utente (Multiplier) e aggiunge/sottrae questo dal massimo/minimo della candela corrente. Un metodo di smussamento (tipo di MA selezionabile) viene applicato all'ATR per regolare la reattività.
Come usarlo:
- Ingresso: Cerca ingressi vicino alla linea centrale durante consolidamenti o dopo segnali di crossover.
- Trailing Stop-Loss: Usa le bande superiori/inferiori come zone dinamiche di uscita per bloccare i profitti mentre le tendenze si estendono.
- Supporto e Resistenza: Queste bande agiscono come zone adattive che riflettono la volatilità recente e aiutano a individuare potenziali punti di inversione.
A differenza delle tradizionali Bollinger Bands, questo approccio ancoraggio le bande agli estremi di prezzo più la volatilità, non a una media mobile, rendendolo più reattivo in ambienti di tendenza e più adattabile per il trading discrezionale o algoritmico.
Riepilogo
Recensioni dei clienti
5 | 50 % | |
4 | 50 % | |
3 | 0 % | |
2 | 0 % | |
1 | 0 % |


