
Descrizione
Indicatori Pinescriptlabs Store: 🤖Pinescriptlabs Store cBots:
SmartTrend Supporto &
Linee di Resistenza Gold & BTC BreakoutSession Pivots(nuovo)YieldShield" 🛡️
Sistema di Breakout del Canale
Struttura Dinamica del Mercato
Analisi dei Punti di Inversione
Fibonacci Lineare
Regressione Multi-timeframe
Proiezione del Flusso di Mercato
Gradiente di Tendenza Dinamico
Bias a Livelli Multipli di Candele
Tracker
Supporto Automatico e
Linee di Tendenza di Resistenza
Tutti i Livelli di Supporto e
Resistenza
Mappa di Liquidazione con Leva
L'indicatore ShieldedTrend si basa su una combinazione intelligente di due metodologie di trading ampiamente utilizzate: candele Heikin-Ashi 📊 e medie mobili esponenziali (EMA) 📈. Ecco la logica passo dopo passo:
1️⃣ Base: Candele Heikin-Ashi Modificate
Le candele Heikin-Ashi sono una versione smussata delle candele tradizionali, progettate per filtrare il rumore di mercato. Il loro calcolo originale utilizza medie dei prezzi, ma ShieldedTrend le modifica in due modi chiave:
- Chiusura Heikin-Ashi:
Calcolata come la media dei 4 prezzi principali della candela reale:
(Open + High + Low + Close) / 4 🔄. - Apertura Heikin-Ashi:
Non presa direttamente dal prezzo reale, ma piuttosto dalla media dell'apertura e chiusura della candela Heikin-Ashi precedente.
Questo crea un effetto "smussamento" naturale che elimina le fluttuazioni brusche, rendendo le tendenze più chiare.
2️⃣ Smussamento con EMA
ShieldedTrend applica una media mobile esponenziale (EMA) a entrambi i componenti delle candele Heikin-Ashi:
- Linea di Apertura Smussata:
L'EMA applicata all'apertura Heikin-Ashi. - Linea di Chiusura Smussata:
L'EMA applicata alla chiusura Heikin-Ashi.
L'EMA dà più peso ai dati recenti, permettendo all'indicatore di reagire rapidamente ai cambiamenti di tendenza mantenendo al contempo la fluidità.
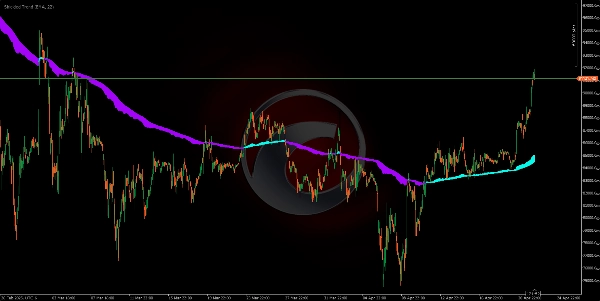
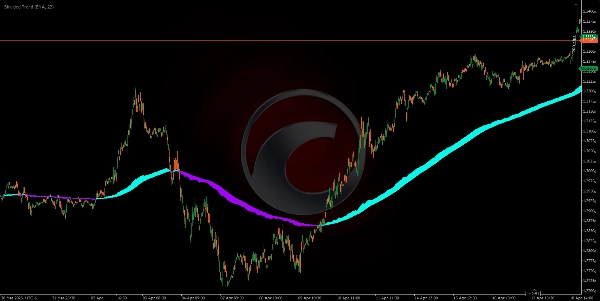
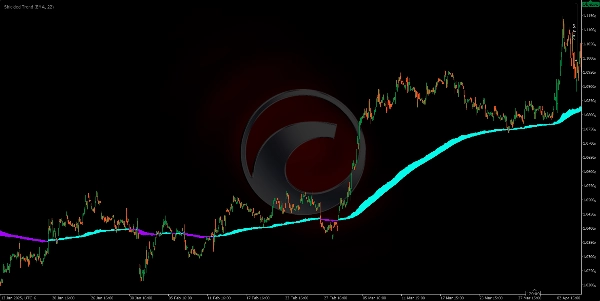
3️⃣ La "Zona di Protezione" (Scudo) 🛡️
L'area colorata tra le due linee (apertura e chiusura smussate) funge da zona di buffer o conferma:
- Larghezza della Zona:
Dipende dalla differenza tra le due linee. -
- Area ampia = Tendenza forte (linee distanti) 💪.
- Area stretta = Indecisione o tendenza debole 🤔.
4️⃣ Logica di Trading Integrata
- Segnale di Tendenza:
Un cambio di colore indica un potenziale inversione (es. da ciano a viola = possibile inizio di una tendenza ribassista) 🔵🟣. - Forza della Tendenza:
La larghezza dell'area colorata funge da filtro di fiducia: -
- Operare solo se l'area è sufficientemente ampia (evita mercati instabili) ✅.
- Protezione contro Movimenti Falsi:
Se l'area si restringe improvvisamente, suggerisce che la tendenza attuale potrebbe perdere slancio—anche se il colore non è ancora cambiato ⚠.
🌟 Perché Funziona?
- Heikin-Ashi + EMA: Smussa il prezzo due volte (candele + media mobile), filtrando il 90% del rumore 🎯.
- Zona di Protezione: Evita di operare in mercati poco chiari, riducendo le operazioni fallite 📉➡️📈.
- Approccio Visivo: La combinazione di colore e area rende facile anche per trader principianti individuare rapidamente i pattern ⚡.
Riepilogo
The indicator applies EMA smoothing to both the Heikin-Ashi open and close lines, enabling quick reaction to trend changes while maintaining smoothness. The area between these two smoothed lines forms a "Protection Zone" or shield, which acts as a buffer and confirmation zone. The width of this zone indicates trend strength: a wide zone signals a strong trend, while a narrow zone suggests indecision or a weak trend.
ShieldedTrend’s integrated trading logic uses color changes to signal potential trend reversals and the zone width as a confidence filter to avoid trading in choppy markets. The indicator helps protect against false moves by signaling when trend momentum is weakening even before a color change occurs. Its visual design facilitates quick pattern recognition, making it accessible for traders of all experience levels.


