Описание
Индикаторы поддержки и сопротивления с поддержкой нескольких таймфреймов обычно позволяют трейдерам визуализировать эти уровни на разных таймфреймах, таких как часовые, дневные, недельные или месячные графики. Включая несколько таймфреймов, трейдеры могут получить более широкую перспективу о том, где расположены ключевые ценовые уровни и как они могут влиять на движение цены.
Этот тип индикатора может помочь трейдерам принимать более обоснованные торговые решения, выявляя значимые уровни поддержки и сопротивления, которые могут влиять на ценовые движения в различных таймфреймах. Он также может помочь трейдерам предвидеть потенциальные развороты или возможности прорыва, когда цена приближается к этим уровням на нескольких таймфреймах.
Существует три типа уровней поддержки и сопротивления:
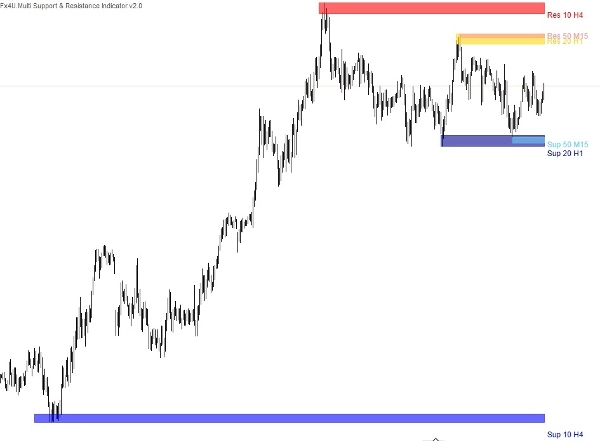
Три индикатора поддержки и сопротивления встроены в этот единый индикатор, позволяя вам наносить зоны спроса и предложения на график с помощью следующих настроек.
- Значение периода.
- Таймфрейм.
- Количество экстремумов – Это количество текущих и прошлых точек поддержки/сопротивления, отображаемых на графике. Например, если выбрать 2, индикатор выберет еще одну точку поддержки и сопротивления в прошлом.
- Название и цвет индикатора.
Уровни поддержки и сопротивления, значимые на более высоких таймфреймах, обычно имеют больший вес, и используя индикатор с несколькими таймфреймами, трейдеры могут подтвердить важность уровня, если он последовательно появляется на нескольких таймфреймах. Это подтверждение повышает надежность уровня и укрепляет уверенность трейдеров в своих торговых решениях.
Мои другие продукты:
https://ctrader.com/products/346
https://ctrader.com/products/336
https://ctrader.com/products/343
https://ctrader.com/products/347
https://ctrader.com/products/147
Сводка
The indicator consolidates three types of support and resistance levels into a single tool, allowing users to plot supply and demand zones with customizable settings such as period value, timeframe, the number of extremum points (current plus past support/resistance points), and indicator name and color. This multi-timeframe approach helps traders identify levels that carry more weight when confirmed across different timeframes, enhancing the reliability of these levels for decision-making.
By visualizing these critical zones, the indicator aids in anticipating potential price reversals or breakout opportunities. It supports a broader market overview, enabling more informed trading strategies based on the interaction of price with established support and resistance across various time horizons.
Отзывы покупателей
5 | 33 % | |
4 | 67 % | |
3 | 0 % | |
2 | 0 % | |
1 | 0 % |
![Логотип продукта "[Fx4U] GBPUSD - Price Action"](https://cdn.ctrader.com/image/webp/d80b34fc-da3c-4f01-a321-456450665649_26190)

![Логотип продукта "[Fx4U] CADJPY - Price Action"](https://cdn.ctrader.com/image/webp/1ba81247-b6b7-4f3c-a297-fa3eb1d57fe1_26195)

![Логотип продукта "[Fx4U] AUDCHF - Price Action"](https://cdn.ctrader.com/image/webp/0a22e9aa-c83b-42cd-b0b8-c1a2da593207_26148)

![Логотип продукта "[Fx4U] EURAUD - Price Action"](https://cdn.ctrader.com/image/webp/baf8dde4-1ef3-4beb-8ae2-0fed8320f65d_26177)