


Mô tả
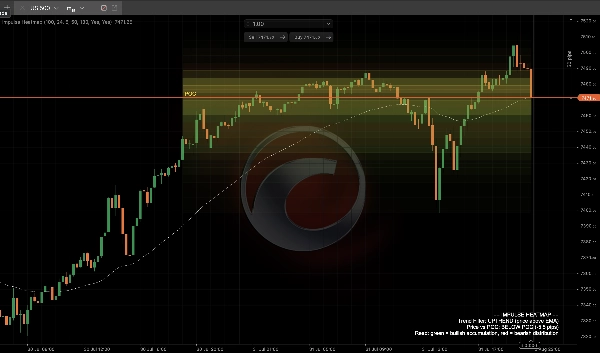
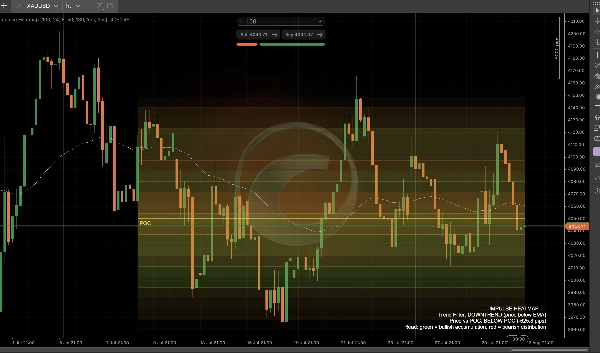
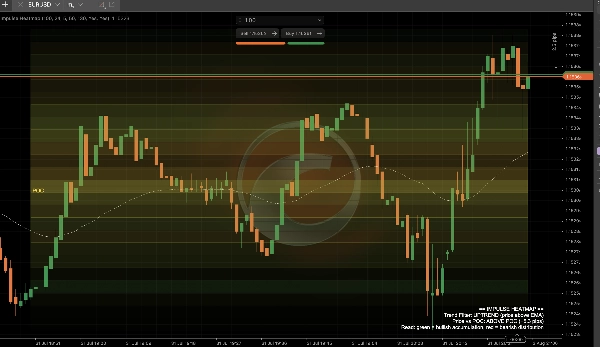
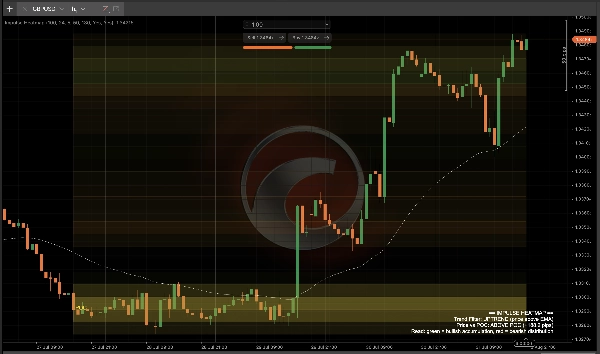
Bản đồ nhiệt khối lượng đang xuất hiện khắp nơi ngay bây giờ, nhưng hầu hết đều chỉ hiển thị một điều: chỉ cường độ, một màu, không có cảm nhận liệu khối lượng đó là mua hay bán. Impulse Heatmap bổ sung phần còn thiếu — mỗi vùng giá được pha màu theo hướng, không chỉ mật độ, để bạn có thể phân biệt được sự tích lũy và phân phối chỉ trong nháy mắt.
Nó phân tích những gì: khối lượng tick trong một cửa sổ nhìn lại liên tục, được phân bổ vào các ô giá theo cách tương tự như hồ sơ khối lượng tiêu chuẩn — ngoại trừ màu của mỗi ô là sự pha trộn của lượng khối lượng đến từ các nến đóng cửa tăng so với các nến đóng cửa giảm ở mức giá đó. Một vùng chủ yếu là khối lượng tăng sẽ phát sáng màu xanh lá (tích lũy); một vùng chủ yếu là khối lượng giảm sẽ phát sáng màu đỏ (phân phối); các vùng hỗn hợp nằm ở giữa.
Cách đọc nó:
- Các vùng sáng, bão hòa = tập trung khối lượng cao — đây là các mức giá mà thị trường đã dành nhiều thời gian và kích thước nhất.
- Các vùng có sắc xanh lá = mức giá đó chủ yếu được xây dựng trên áp lực tăng — một khu vực hỗ trợ/tích lũy tiềm năng.
- Các vùng có sắc đỏ = mức giá đó chủ yếu được xây dựng trên áp lực giảm — một khu vực kháng cự/phân phối tiềm năng.
- Đường POC màu vàng theo dõi trọng tâm làm mịn của khối lượng — nơi "giá trị công bằng" thực sự hiện đang nằm, không bị nhảy nhót như tính toán điểm kiểm soát thô.
- Bộ lọc xu hướng EMA màu trắng cho bạn bối cảnh: vùng nhiệt hiện tại đang ủng hộ xu hướng chủ đạo hay đang chống lại nó?
- Bảng HUD trực tiếp cho bạn biết trạng thái xu hướng và chính xác giá đang cách POC bao nhiêu pip.
Cài đặt chính: độ dài cửa sổ nhìn lại, số lượng ô giá (độ phân giải), làm mịn POC, chu kỳ EMA bộ lọc xu hướng, và tùy chỉnh màu sắc đầy đủ cho cả pha trộn tăng/giảm và đường POC.
Các trường hợp sử dụng điển hình: phát hiện xem một vùng hỗ trợ/kháng cự được xây dựng dựa trên áp lực mua hoặc bán thực sự thay vì chỉ khối lượng thô; sử dụng POC như một nam châm giá trị công bằng động; xác nhận xem khối lượng ở mức hiện tại có đồng thuận hay mâu thuẫn với xu hướng chủ đạo; kết hợp với mô hình vào lệnh của bạn như một bộ lọc bối cảnh khối lượng.
Phù hợp nhất cho: các nhà giao dịch trong ngày trên các cặp forex chính, vàng và chỉ số muốn nhiều hơn một thanh khối lượng phẳng hoặc bản đồ nhiệt một màu — hữu ích như một công cụ đọc độc lập hoặc kết hợp cùng các thiết lập dựa trên cấu trúc.
Tóm tắt
Key features include:
- Bright, saturated zones highlighting high volume concentration price levels.
- A gold Point of Control (POC) line representing a smoothed volume center of gravity as a dynamic fair value reference.
- A white trend filter EMA providing context on whether volume zones align with or oppose the prevailing trend.
- A live HUD panel displaying trend state and price distance from the POC in pips.
- Customizable settings for lookback window, price bin resolution, POC smoothing, trend filter EMA period, and color schemes.
Impulse Heatmap is suited for intraday traders focusing on forex majors, gold, and indices who require enhanced volume context to distinguish genuine buying or selling pressure at key support and resistance levels. It can be used standalone or combined with other structural or entry models.
Thảo luận
Đánh giá của khách hàng
Câu hỏi thường gặp
Sản phẩm khác của tác giả này






























Giá