
Descrição
Market Cipher A é um indicador técnico avançado projetado para facilitar a análise, identificação e previsão de tendências macro no mercado de criptomoedas.
Estrutura e Componentes
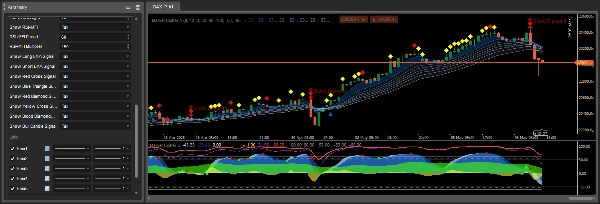
Market Cipher A consiste em uma faixa de 8 médias móveis exponenciais (EMA) que mudam de cor dependendo da tendência do mercado. A faixa de EMA fica azul ou branca durante um mercado em alta e cinza durante um mercado em baixa.
Por padrão, são usadas médias móveis com valores de EMA de 5 a 34. Os cruzamentos dessas linhas podem ser indicadores defasados muito fortes, por isso o Market Cipher A foi programado para exibir automaticamente símbolos correspondentes a diferentes sinais, eliminando a necessidade de interpretação manual de cada cruzamento de alta ou baixa.
Símbolos e Sinais de Negociação
Market Cipher A exibe símbolos característicos diretamente no gráfico de velas que indicam oportunidades potenciais de negociação:
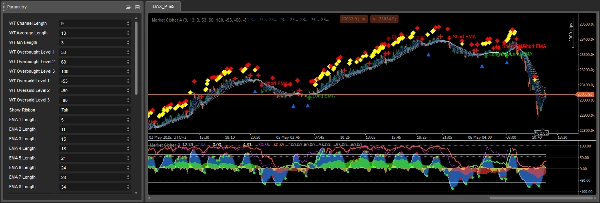
Triângulo Azul - sinal de reversão de tendência, indica diminuição do momentum e uma reversão iminente. É um aviso precoce de que o momentum da tendência está diminuindo.
Círculo Verde - indicador de alta, mais confiável em períodos de 6 horas ou superiores. Normalmente aparece após um triângulo azul e deve ser interpretado dentro de um intervalo de 1 a 3 velas.
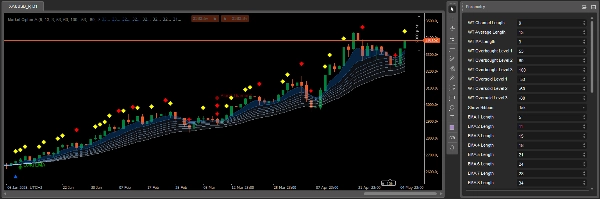
Losangos Amarelos - indicam continuação da tendência de alta. Devem ser usados junto com a faixa de EMA para melhor confirmação da direção da tendência.
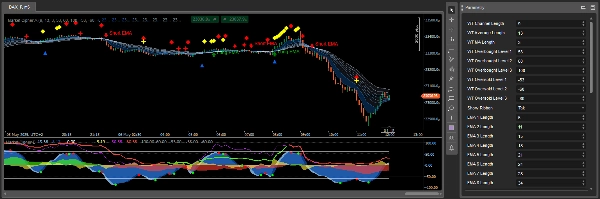
Losangos Vermelhos - sinalizam enfraquecimento da tendência e possível continuação para baixo. Indicam aumento do momentum de baixa.
X Vermelho - indicador de baixa, mais eficaz em períodos de 1 hora ou superiores. Deve ser usado junto com a faixa de EMA e o losango vermelho.
X Amarelo - indica manipulação de mercado, particularmente cobertura de grandes posições longas que são rapidamente compradas e vendidas por posições curtas.
Grande Losango Vermelho (Losango Sangrento) - o sinal mais baixista, indicando alta probabilidade de queda, especialmente quando ocorre junto com um X vermelho ou losango vermelho menor.
Princípios de Uso
Market Cipher A fornece suporte ou resistência matemática forte visualmente, permitindo fácil compreensão do ambiente de negociação. Funciona melhor com velas Heiken Ashi.
A faixa de EMA não apenas indica a tendência, mas também atua como níveis dinâmicos de suporte e resistência. Quando a faixa está azul/branca e as velas estão acima dela, você pode procurar oportunidades para posições longas. Quando a faixa está cinza e as velas estão abaixo dela, você pode considerar posições curtas.
Os melhores resultados são alcançados quando os sinais do Market Cipher A são combinados com outros indicadores do pacote Market Cipher, particularmente o Market Cipher B, que fornece sinais adicionais de momentum e pontos de entrada.
Interpretação Detalhada dos Sinais no Contexto da Tendência
Um aspecto importante do Market Cipher A é a interpretação contextual dos sinais dependendo da tendência dominante. Quando a faixa muda de cor de cinza para azul, o indicador gera um círculo verde como sinal do início de uma tendência de alta. Normalmente, após um círculo verde, se as próximas 1-3 velas exibirem um losango amarelo, a probabilidade de um rompimento é alta. No entanto, se aparecerem losangos vermelhos, o rompimento é menos provável.
Durante um mercado em alta, losangos amarelos são favoráveis, mostrando continuação para cima alinhada com a tendência, enquanto losangos vermelhos representam um movimento contra a tendência. Em um mercado em baixa, a situação é invertida - losangos vermelhos são favoráveis como continuação da queda, e losangos amarelos indicam um movimento temporário para cima contrário à tendência.
O X vermelho é mais confiável quando aparece após um losango vermelho e a faixa de EMA está quase completamente contraída, mudando a cor para cinza baixista. A precisão deste indicador varia dependendo do período de tempo.
Mecanismo de Operação e Gênese dos Sinais
Os símbolos e sinais no Market Cipher A são gerados com base em várias fontes: cruzamentos da onda WaveTrend, níveis de sobrecompra e sobrevenda, e baseados no RSI e MFI quando cruzam a linha central ou atingem condições de sobrecompra e sobrevenda. Essa análise multidimensional torna os sinais mais abrangentes do que indicadores únicos.
A faixa de EMA consiste em 8 médias móveis que formam uma faixa característica com separação entre as bandas individuais. A separação das bandas é um fator importante - separação ampla indica uma tendência forte, enquanto bandas contraídas sugerem enfraquecimento do momentum ou consolidação.
Aplicação Prática em Estratégias de Negociação
Market Cipher A foi projetado principalmente como uma ferramenta de análise de tendência, portanto funciona melhor em estratégias que seguem a tendência. Recomenda-se usar a faixa junto com outros indicadores de identificação de tendência, e então buscar oportunidades de negociação durante retrações de preço.
É importante lembrar que esses sinais ajudam a ajustar o tempo de entrada ou saída das negociações, mas não devem ser usados isoladamente para tomar decisões de negociação. Confirmações adicionais são necessárias, especialmente para sinais de reversão que ocorrem durante movimentos laterais de preço.
Resumo
The indicator automatically displays distinct symbols on the price chart to signal potential trading opportunities:
- Blue Triangle: signals declining momentum and possible trend reversal.
- Green Circle: indicates a bullish trend start, most reliable on 6-hour timeframes and above.
- Yellow Diamonds: suggest continuation of an upward trend.
- Red Diamonds: indicate trend weakening and potential downward continuation.
- Red X: bearish signal effective on 1-hour timeframes and higher.
- Yellow X: points to market manipulation events.
- Large Red Diamond ("Blood Diamond"): strong bearish signal with high probability of decline.
Signals are generated using a combination of WaveTrend crossovers, RSI, and MFI indicators, providing multidimensional market analysis. Market Cipher A is optimized for use with Heiken Ashi candles and is best applied within trend-following strategies, ideally combined with other Market Cipher indicators for enhanced entry and momentum confirmation.
Avaliações de clientes
5 | 67 % | |
4 | 33 % | |
3 | 0 % | |
2 | 0 % | |
1 | 0 % |


![Logótipo de "Gaussian Channel [Iridio Capital]"](https://cdn.ctrader.com/image/webp/7c039209-5573-4a54-a072-f9528b503103_41960)


