
E7 BBKG Indicator
Indicador
2 compras
Versão 1.0, Feb 2025
Windows, Mac
5.0
Avaliações: 2
Descrição
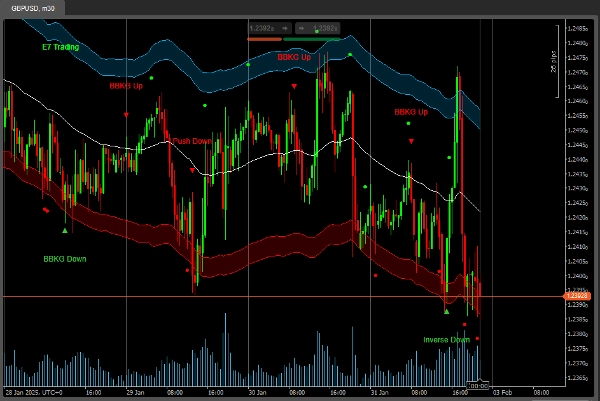
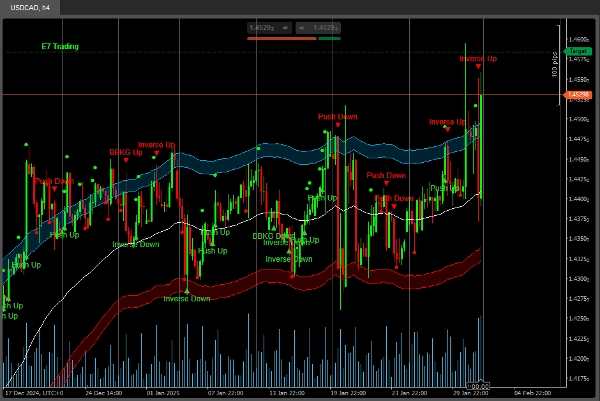
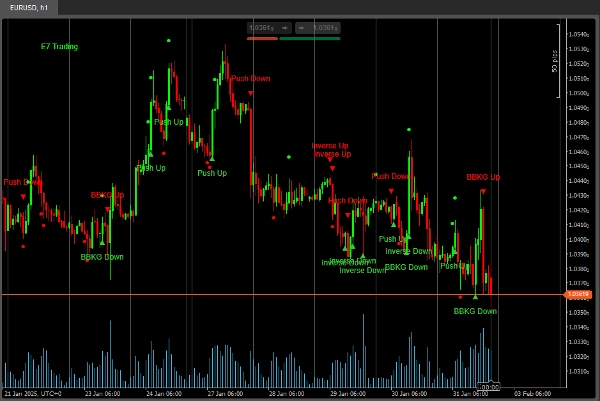
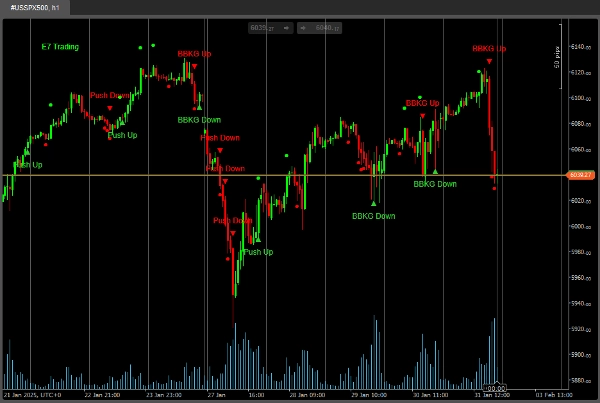
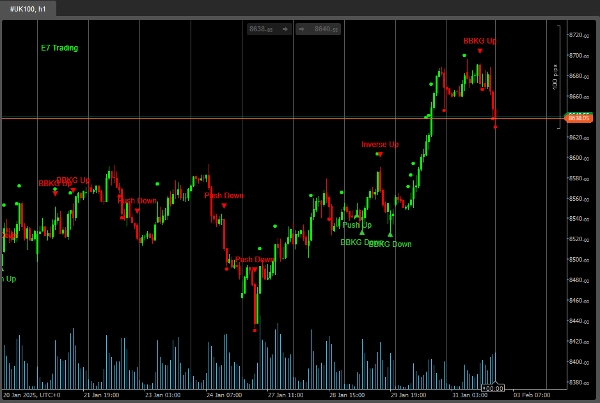
Com uma taxa de precisão superior a 80%, este é um indicador personalizado usado para mostrar tanto possíveis reversões quanto áreas de tendência nos movimentos de preço. Idealmente usado com o sistema E7.
Este é um indicador personalizado e proprietário desenvolvido usando o sistema de aprendizado profundo de rede neural E7Qnet.
Algumas das imagens abaixo incluem nosso indicador personalizado E7 Polynomial Regression Channel, conforme usado na estratégia E7.
Boa caça!
Resumo
Resumo de IA
The E7 BBKG Indicator is a custom proprietary trading indicator developed using the E7Qnet deep neural network learning system. It is designed to identify potential price reversal and trending areas with an accuracy rate exceeding 80%. This indicator is ideally used in conjunction with the E7 trading system and supports analysis across various markets, as demonstrated in examples including currency pairs like GBPUSD, USDCAD, EURUSD, and indices such as S&P500 and UK100. The product incorporates advanced machine learning techniques to enhance the detection of significant price movement zones, aiding traders in decision-making. Visual references include the E7 Polynomial Regression Channel indicator, which complements the E7 strategy.
Perfil do indicador
Avaliações de clientes
5.0
Avaliações: 2
5 | 100 % | |
4 | 0 % | |
3 | 0 % | |
2 | 0 % | |
1 | 0 % |
Avaliações de clientes
February 3, 2025
Conversa
Perguntas frequentes
Prop
Os produtos disponíveis através da cTrader Store, incluindo bots de negociação, indicadores e plugins, são fornecidos por programadores terceiros e são disponibilizados apenas para fins informativos e de acesso técnico. A cTrader Store não é um corretor e não fornece aconselhamento em matéria de investimento, recomendações pessoais ou qualquer garantia de desempenho no futuro.
Mais deste autor


Preço
Desde 18/12/2024
2
Vendas
4.26K
Instalações gratuitas