
DARK POLL SIGNAL_noSourceCode
Indicador
1 compras
Versão 1.0, Mar 2025
Windows, Mac
5.0
Avaliações: 2
Descrição
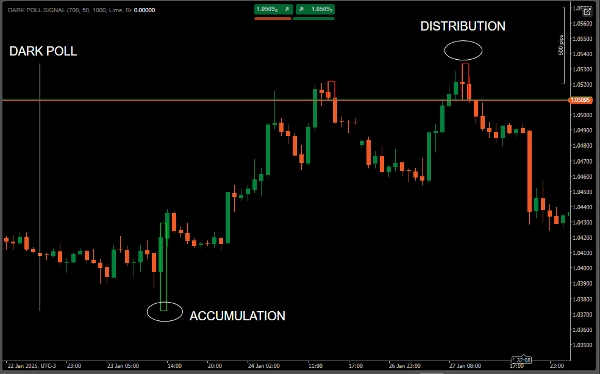
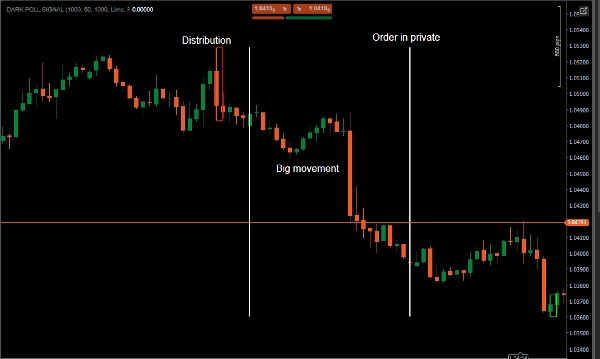
No sinal do dark pool, onde precede os grandes movimentos, em particular, após a acumulação pode iniciar uma tendência de alta. E após a distribuição uma tendência de baixa.
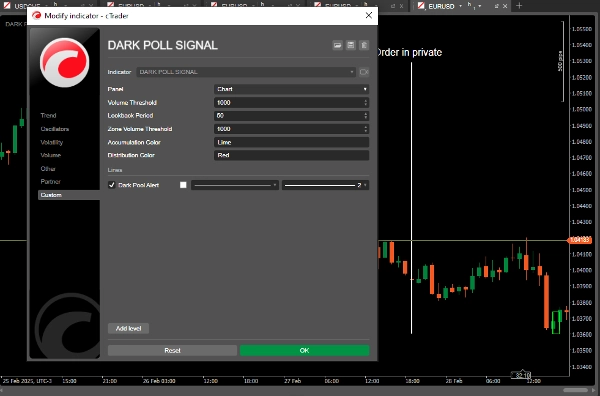
1-Volume do Dark Pool: Se o volume de ticks for baixo, um histograma branco é exibido, o que é um vazamento de liquidez.
2-O indicador verifica volume significativo e consolidação de preço.
Se detectado, ele desenha um retângulo na área correspondente.
Desenho:
Zonas de acumulação são destacadas em verde.
Zonas de distribuição são destacadas em vermelho.
Este indicador combinado permite monitorar tanto a atividade do Dark Pool quanto as zonas de acumulação/distribuição em um único painel.
Resumo
Resumo de IA
The DARK POLL SIGNAL indicator monitors Dark Pool volume and identifies key accumulation and distribution zones to anticipate significant market movements. It analyzes tick volume, displaying a white histogram to indicate liquidity leaks when volume is low. The indicator detects areas of significant volume and price consolidation, marking these zones with rectangles: green for accumulation and red for distribution. This visual representation helps users track potential upward trends following accumulation phases and downward trends after distribution phases. By combining Dark Pool activity with accumulation and distribution zone detection in a single panel, the indicator provides a consolidated view of market liquidity and price behavior.
Perfil do indicador
Avaliações de clientes
5.0
Avaliações: 2
5 | 100 % | |
4 | 0 % | |
3 | 0 % | |
2 | 0 % | |
1 | 0 % |
Avaliações de clientes
March 5, 2025
The logic holds up when the trade idea gets slowed down first, and two sessions say more than one clean chart.
Conversa
Perguntas frequentes
Signal
Os produtos disponíveis através da cTrader Store, incluindo bots de negociação, indicadores e plugins, são fornecidos por programadores terceiros e são disponibilizados apenas para fins informativos e de acesso técnico. A cTrader Store não é um corretor e não fornece aconselhamento em matéria de investimento, recomendações pessoais ou qualquer garantia de desempenho no futuro.


Preço
116
Vendas
9.31K
Instalações gratuitas