
说明
主要目标:
按价格水平映射成交量分布以识别:
高流动性区域
低流动性区域
买卖双方的不平衡
该指标对于理解市场结构和识别高概率操作区域非常强大! 🎯
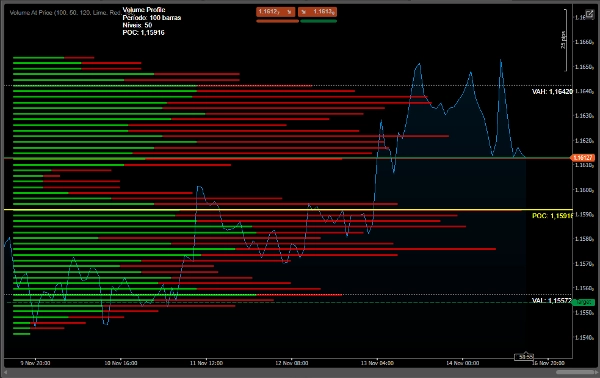
1. POC(控制点)
Linha Amarela - 交易量最高的价格
最大流动性和价格区域
自然支撑/阻力
2. 价值区
白线 - 交易量占70%的区域
VAH(价值区高点)- 上限
VAL(价值区低点)- 下限
市场平衡区
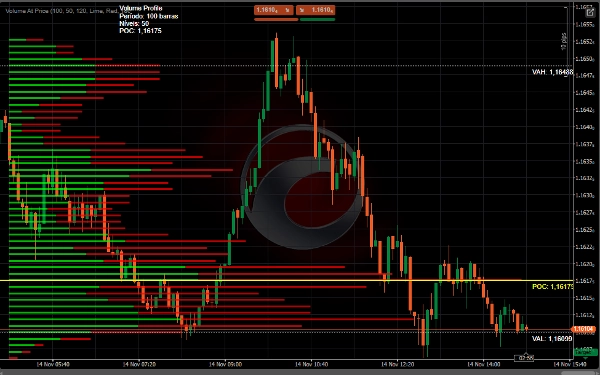
3. 成交量核心
🟢 绿色 - 主导买入量
🔴 红色 - 主导卖出量
柱长 = 成交量强度
📊 使用策略
1. 支撑和阻力的识别
• POC 作为动态支撑/阻力
• 价值区定义平衡区
• 重要的支撑/阻力轮廓边缘
2. 突破分析
• 突破 VAH → 上升趋势
• 跌破 VAL → 下降趋势
• 非突破成交量确认走势
3. 进场点
• 买入:用买方成交量重新测试 VAL
• 卖出:用卖方成交量重新测试 VAH
• 反向操作:在轮廓极端位置操作
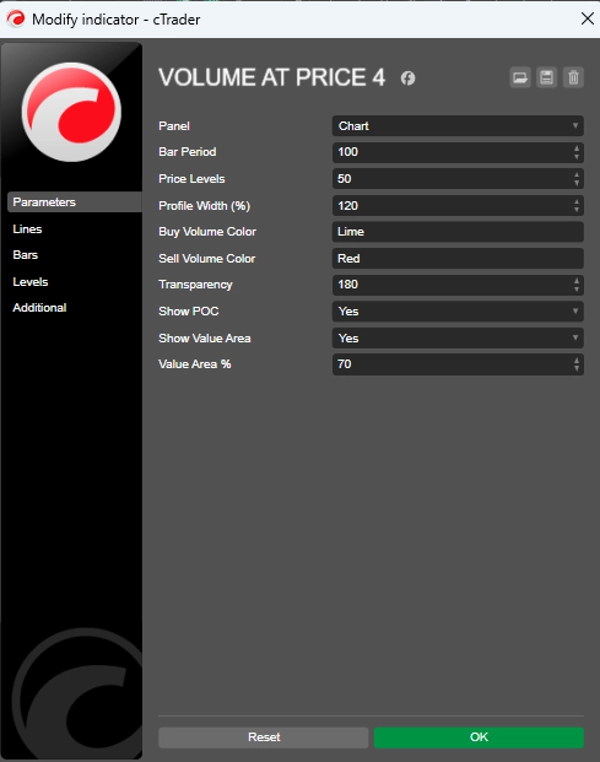
⚙️ 推荐配置
日内交易
csharp
周期 = 50-100
价格水平 = 50
轮廓宽度 = 120%
价值区百分比 = 70
波段交易
csharp
周期 = 100-200
价格水平 = 80
轮廓宽度 = 150%
价值区百分比 = 70
✅ 优点:
识别动态支撑/阻力
显示市场意图(成交量)
揭示重要流动性区域
清晰显示不平衡
当前成交量计数
摘要
AI 摘要
Volume Profile Price is a trading indicator that maps volume distribution across price levels to highlight market structure features such as high and low liquidity areas and buyer-seller imbalances. It displays key elements including:
- Point of Control (POC): The price level with the highest traded volume, acting as a dynamic support or resistance.
- Value Area: The price range where 70% of volume is traded, defined by Value Area High (VAH) and Value Area Low (VAL), representing market balance zones.
- Volume Cores: Colored bars indicating dominant buying (green) or selling (red) volume, with bar length reflecting volume intensity.
The indicator supports strategies like identifying support and resistance levels, breakout analysis (trend direction based on VAH and VAL breaks), and entry points (buy near VAL with buyer volume, sell near VAH with seller volume, or fade at profile extremes).
Recommended settings vary by trading style: for day trading, shorter periods and narrower profiles; for swing trading, longer periods and wider profiles. This tool aids in visualizing liquidity, market intent, and volume imbalances to inform trading decisions.
指标配置
客户评价
3.5
评价:2
5 | 0 % | |
4 | 50 % | |
3 | 50 % | |
2 | 0 % | |
1 | 0 % |
客户评价
May 27, 2026
I think this is a good indicator. It does as it states - PoC, VAL & VAH. However, the downside is that, sadly, I trade with the white screen and this is really created for those who use a dark sreen. Therefore I can't see the VAL & VAH zones, as their colour is white with no option to change to a darker colour. So, it's unfortunately unusable for me.
讨论
常见问答
Forex
Fair Value Gap
cTrader Store 提供的所有产品,包括交易机器人、指标和插件,均由第三方开发者提供,仅供信息参考和技术访问之用。cTrader Store 并非经纪商,不提供投资建议、个人推荐或任何未来业绩保证。


猜您喜欢


价格
111
销售
8.53K
免费安装