

Descrição
# 🚀 Índice de Deslizamento Cinético (KSI) – Ferramenta Avançada de Análise de Pressão de Mercado e Liquidez
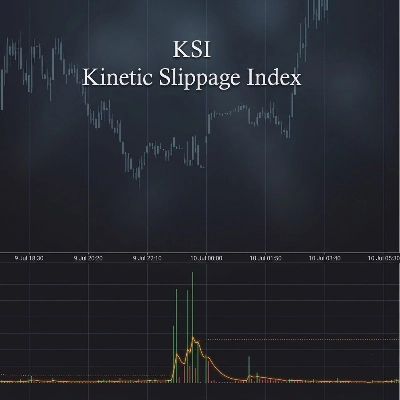
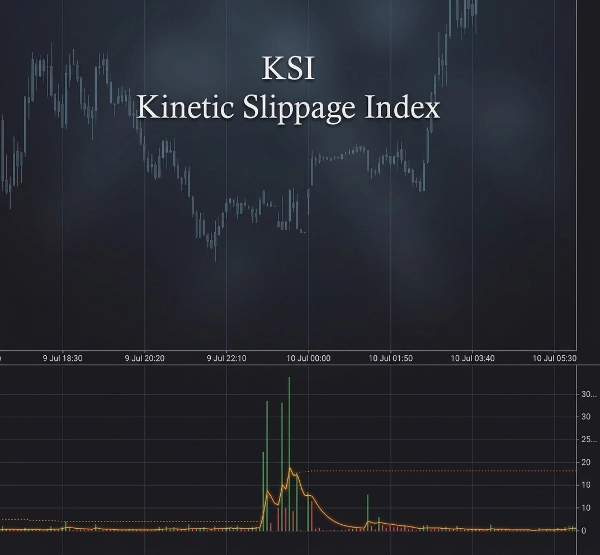
Desbloqueie insights mais profundos do mercado com o **Índice de Deslizamento Cinético (KSI)** — um poderoso indicador de negociação projetado para identificar movimentos de preço incomuns, desequilíbrio de volume e potenciais eventos de liquidez antes que se tornem óbvios no gráfico.
Construído para traders que analisam **estrutura de mercado, comportamento de volume, volatilidade e atividade institucional**, o KSI combina expansão de faixa e dinâmica de volume para medir condições anormais do mercado.
## 🔥 Principais Características
✅ **Cálculo do Índice de Deslizamento Cinético**
* Mede a relação entre o movimento do preço e o volume negociado.
* Detecta situações onde o preço se move desproporcionalmente em comparação ao comportamento normal do volume.
* Ajuda a identificar potenciais estresses de liquidez, atividade agressiva do mercado e momentum incomum.
✅ **Detecção Adaptativa de Picos**
* Calcula automaticamente níveis dinâmicos de pico com base no comportamento recente do mercado.
* Usa análise de desvio estatístico para destacar eventos extremos do mercado.
* Adapta-se às condições de volatilidade em mudança sem exigir ajustes manuais constantes.
✅ **Alertas de Pico em Tempo Real 🚨**
* Receba notificações quando ocorrer divergência anormal de volume/faixa.
* Ajuda os traders a identificar rapidamente potenciais condições de rompimento, capturas de liquidez ou pressão súbita do mercado.
✅ **Análise de Volume e Fluxo 📊**
* Acompanha o volume atual comparado à sua média EMA.
* Destaca quando a atividade de negociação está anormalmente alta.
* Inclui análise delta cumulativa para visualizar pressão de compra e venda.
✅ **Confirmação da Linha de Sinal 📈**
* Cálculo suave do sinal ajuda a identificar mudanças no momentum do KSI.
* Visualização em histograma verde/vermelho facilita a leitura das mudanças na pressão do mercado.
## 🕒 Inteligência da Sessão de Negociação
O KSI inclui rastreamento automático das sessões de mercado:
🌏 Sessão da Ásia
🇬🇧 Sessão de Londres
🇺🇸 Nova York AM
☕ Almoço em Nova York
🌆 Nova York PM
A exibição integrada da killzone ajuda os traders a entender quando a liquidez e a volatilidade são tipicamente maiores.
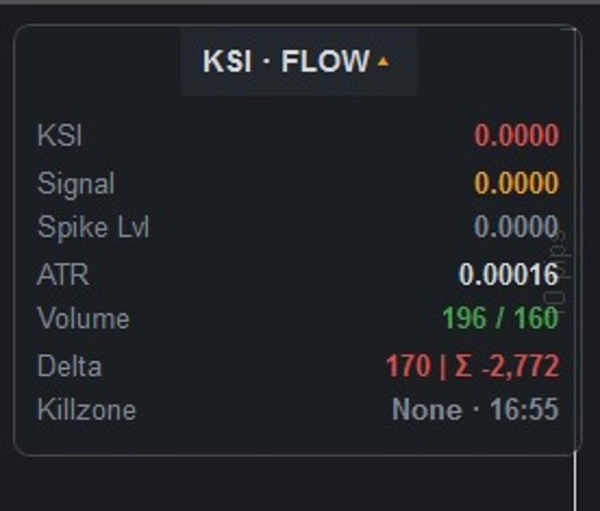
## 📌 Painel de Informações Profissional
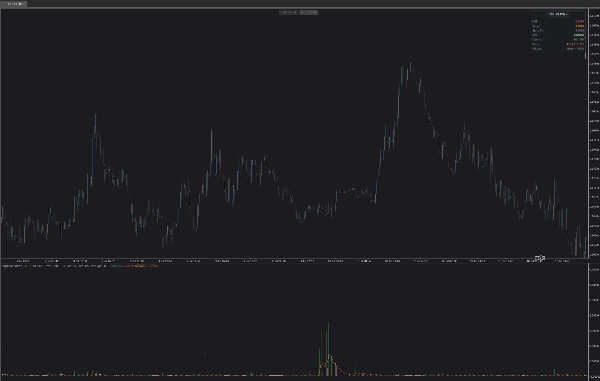
O painel integrado fornece uma visão limpa diretamente no seu gráfico:
📍 Valor atual do KSI
📍 Nível do sinal
📍 Limite adaptativo de pico
📍 Leitura de volatilidade ATR
📍 Volume atual vs volume médio
📍 Delta e delta cumulativo
📍 Sessão de negociação ativa / killzone
O painel pode ser:
* ✅ Posicionado em qualquer canto do gráfico
* ✅ Recolhido ou expandido
* ✅ Ajustado com opacidade personalizada
## ⚙️ Configurações Personalizáveis
Ajuste o KSI para qualquer estilo de negociação:
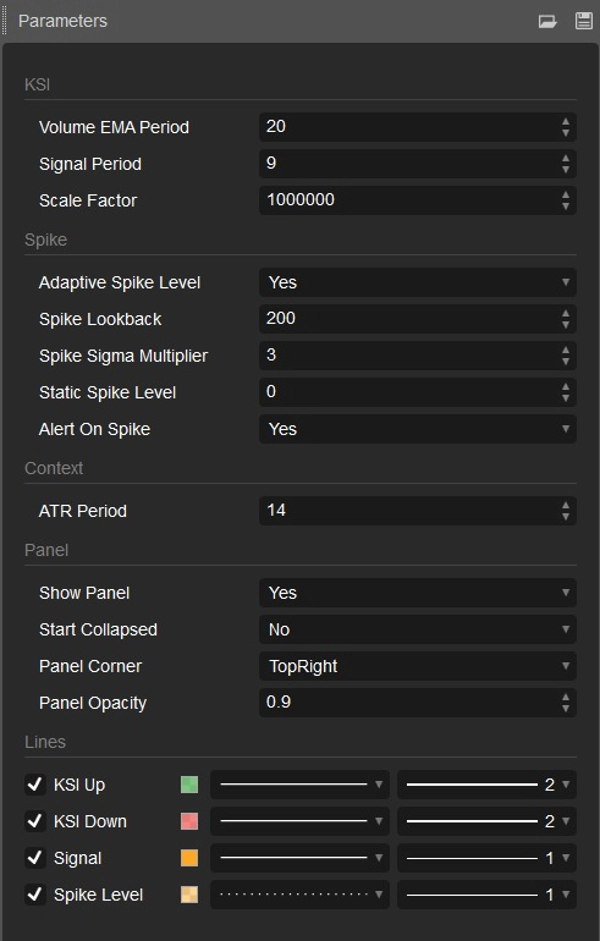
🔧 Período EMA do Volume
🔧 Período do Sinal
🔧 Fator de Escala
🔧 Detecção de pico adaptativa ou fixa
🔧 Período de retrocesso do pico
🔧 Multiplicador de sensibilidade do pico
🔧 Período ATR
🔧 Configurações de aparência do painel
## 🎯 Projetado Para
✔ Traders de Forex
✔ Traders de Futuros
✔ Traders de Cripto
✔ Scalpers
✔ Traders de Day Trade
✔ Analistas de estrutura de mercado
✔ Traders que buscam confirmação baseada em volume
## 💡 Como os Traders Usam o KSI
O KSI pode ajudar a identificar:
⚡ Atividade incomum do mercado
⚡ Potencial pressão de rompimento
⚡ Divergência volume-preço
⚡ Eventos de liquidez
⚡ Mudanças de momentum
⚡ Oportunidades de negociação em alta volatilidade
Combine o KSI com sua estratégia existente para obter uma visão mais clara de **quando o mercado está se movendo normalmente — e quando algo incomum está acontecendo.**
📈 Negocie com mais inteligência. Entenda a pressão do mercado. Detecte atividades ocultas com o Índice de Deslizamento Cinético.
Resumo
The indicator includes volume and flow analysis by comparing current volume to its exponential moving average (EMA) and incorporates cumulative delta analysis to visualize buying and selling pressure. A smooth signal line and histogram help confirm changes in KSI momentum, making shifts in market pressure easier to interpret.
KSI tracks major trading sessions—Asia, London, and New York (AM, Lunch, PM)—highlighting periods of higher liquidity and volatility. A professional information panel displays key metrics such as current KSI value, signal level, adaptive spike threshold, ATR volatility, volume comparisons, delta values, and active trading sessions. This panel is customizable in position, size, and opacity.
Settings allow fine-tuning of volume EMA period, signal period, scale factor, spike detection parameters, ATR period, and panel appearance. KSI is suitable for forex, futures, and crypto traders, including scalpers, day traders, and market structure analysts seeking volume-based confirmation and insights into unusual market activity, breakout pressure, liquidity events, and momentum changes.
Conversa
Avaliações de clientes
5 | 0 % | |
4 | 100 % | |
3 | 0 % | |
2 | 0 % | |
1 | 0 % |
Perguntas frequentes
Mais deste autor

Também poderá gostar de














Preço