
MTF Candle Countdown
Indicatore
3 acquisti
Versione 1.0, Feb 2025
Windows, Mac
4.5
Recensioni: 2
Descrizione
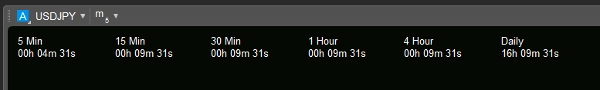
Il Indicatore di conto alla rovescia per la chiusura della candela aiuta i trader a rimanere preparati mostrando un conto alla rovescia in tempo reale per la chiusura dei principali intervalli di tempo: 5m, 15m, 30m, 1H, 4H e candele giornaliere. Questo strumento garantisce che non ti perda mai un momento chiave dell’azione del prezzo, aiutando con il tempismo preciso delle operazioni e l’esecuzione della strategia. Rimani in controllo e prendi decisioni informate con una visione chiara di quando si formerà la prossima candela!
Riepilogo
Riepilogo AI
The MTF Candle Countdown indicator provides a real-time countdown to the close of key candle timeframes including 5-minute, 15-minute, 30-minute, 1-hour, 4-hour, and daily intervals. By displaying the remaining time until the next candle forms, it assists traders in precise trade timing and strategy execution. This tool supports better decision-making by clearly indicating when significant price action moments will occur across multiple major timeframes. It is designed for use on bar-based charts and offers visual countdown information to help traders stay prepared for market changes.
Profilo indicatore
Categoria indicatore
Volume
Tipo di output
Visualizzazione
Requisiti per i dati
Solo barre
Segnali supportati
Rottura
Forza del trend
Intervallo di apertura della sessione
Recensioni dei clienti
4.5
Recensioni: 2
5 | 50 % | |
4 | 50 % | |
3 | 0 % | |
2 | 0 % | |
1 | 0 % |
Recensioni dei clienti
February 19, 2025
Not perfect, but the workflow felt cleaner. 20 signals gives enough for a first read.
Discussioni
Domande frequenti
MSS
BOS
CHOCH
Moving Average
I prodotti disponibili tramite cTrader Store, inclusi bot di trading, indicatori e plugin, sono forniti da sviluppatori terzi e resi disponibili esclusivamente a scopo informativo e di accesso tecnico. cTrader Store non è un broker e non fornisce consulenze in materia di investimento, raccomandazioni individualizzate o garanzie di risultati futuri.


Prezzo
Da 14/01/2025
55
Vendite
11.36K
Installazioni gratuite