
Описание
Индикатор прорыва волатильности - Hawkes Volatility Engine
Этот индикатор предназначен для предоставления контекста, а не для немедленных торговых действий. Компонент волатильности помогает понять, когда меняются рыночные условия — периоды низкой волатильности часто предшествуют большим движениям, а периоды высокой волатильности в конечном итоге истощаются. Компонент EWMA помогает ориентироваться в развивающемся тренде и выделяет моменты, когда цена отдаляется от него.
Объедините эти две перспективы — режим волатильности и контекст тренда — с вашей собственной торговой методологией и суждениями. Индикатор показывает вам окружение — вы решаете, что в нем делать.
Версия 2.0
Открыт для будущих обновлений
-----------------------------------------------------------------------------------------------------------------------------------------------------------------------
Обзор
-----------------------------------------------------------------------------------------------------------------------------------------------------------------------
Этот индикатор объединяет два различных компонента, чтобы помочь трейдерам одновременно определять режимы волатильности и условия тренда.
Первый компонент использует процесс Хоукса для обнаружения изменений в рыночной волатильности. В отличие от традиционных индикаторов волатильности, он не предсказывает направление — он просто сигнализирует, когда рынок переходит от спокойного сжатия к активной волатильности или наоборот. Можно считать его детектором состояния волатильности: он сообщает, когда ситуация накаляется или остывает, но не указывает, в какую сторону пойдет цена.
Второй компонент добавляет двойную систему EWMA (экспоненциально взвешенное скользящее среднее), которая накладывается на ваш график цены. Это дает контекст тренда с помощью пересечения быстрого и медленного скользящих средних, а также дополнительный слой окраски свечей, показывающий, когда цена отклоняется от тренда.
-----------------------------------------------------------------------------------------------------------------------------------------------------------------------
Как это работает
-----------------------------------------------------------------------------------------------------------------------------------------------------------------------
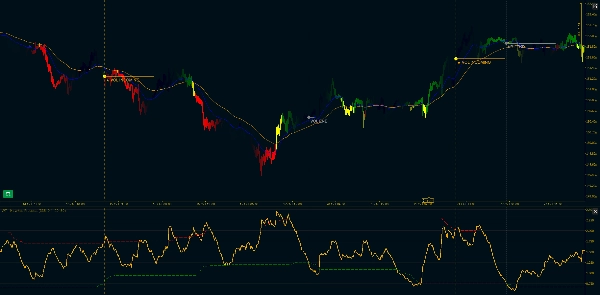
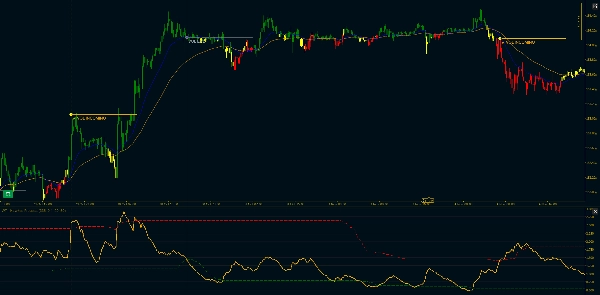
Обнаружение волатильности: Индикатор использует оценку волатильности Parkinson High-Low — более эффективный метод, чем стандартный ATR, поскольку он использует полный диапазон бара. Эта нормализованная волатильность подается в расчет процесса Хоукса, который затем сравнивается с динамическими порогами на основе квантилей.
Когда волатильность пробивает верхний порог после периода сжатия, вы получаете сигнал "VOL INCOMING". Когда она опускается ниже нижнего порога, появляется "VOL END". Это не сигналы для входа — это изменения режима волатильности. Рынок либо просыпается, либо засыпает.
Контекст тренда: На вашем основном графике появляются две экспоненциально взвешенные скользящие средние (быстрая и медленная). Быстрая MA синяя, медленная MA оранжевая. Когда Быстрая выше Медленной, тренд восходящий. Когда Быстрая ниже Медленной, тренд нисходящий.
Фильтр дивергенции: Здесь начинается самое интересное. Иногда цена значительно отдаляется от тренда. Когда вся свеча (открытие, максимум, минимум, закрытие) находится ниже Быстрой MA во время восходящего тренда или выше нее во время нисходящего, бар окрашивается в желтый цвет. Это строгий фильтр — если даже тень касается Быстрой MA, цвет остается обычным для тренда.
Желтые бары часто появляются на откатах или точках истощения, но помните: они не говорят, что будет дальше, а лишь показывают, что цена временно отделилась от линии тренда.
-----------------------------------------------------------------------------------------------------------------------------------------------------------------------
Ключевые особенности
-----------------------------------------------------------------------------------------------------------------------------------------------------------------------
Компонент волатильности:
- Нормализация волатильности Parkinson High-Low (эффективнее стандартного метода ATR)
- Расчет процесса Хоукса с регулируемым затуханием (параметр Kappa)
- Динамические пороги на основе квантилей (настраиваемые перцентили)
- Визуальные маркеры: "VOL INCOMING" при прорывах волатильности, "VOL END" при сжатиях
- Фильтрация продолжений: отмечается только первый прорыв, а не каждый всплеск
- Опциональные горизонтальные трендовые линии и вертикальные маркеры
Компонент тренда EWMA:
- Расчет EWMA, совместимый с Pandas (формула adjust=True)
- Линии Быстрой и Медленной MA отображаются на основном графике цены
- Настраиваемые длины периодов (по умолчанию: 20/50)
- Поддержка минимального количества периодов (подавляет вывод до накопления достаточных данных)
- Опция игнорирования NA для обработки разрывов
- Трехцветная система свечей: Зеленый (восходящий тренд), Красный (нисходящий тренд), Желтый (дивергенция)
Опции настройки:
- Период Parkinson (окно для расчета волатильности)
- Kappa Хоукса (скорость затухания, влияет на чувствительность)
- Период обратного отсчета квантилей
- Пороги низкой и высокой волатильности (перцентили)
- Переключатель годовой нормализации и длина сегмента
- Длины периодов Быстрой и Медленной MA
- Цвета для бычьего, медвежьего тренда и дивергенции
- Длина расширения трендовой линии
- Показать/скрыть вертикальные маркеры
----------------------------------------------------------------------------------------------------------------------------------------------------------------------------
Техническая заметка: Компонент процесса Хоукса использует рекурсивный экспоненциальный расчет, оптимизированный для работы в реальном времени. Реализация EWMA соответствует поведению Pandas для согласованности с бэктестингом на Python. Оба компонента рассчитываются только на закрытых барах, чтобы избежать перерисовки.
Сводка
Отзывы покупателей
5 | 100 % | |
4 | 0 % | |
3 | 0 % | |
2 | 0 % | |
1 | 0 % |


![Логотип продукта "[Hamster-Coder] Bollinger Bands"](https://cdn.ctrader.com/image/webp/21d8e5d6-fb11-4bac-b9ee-cd05c2b76804_30327)


![Логотип продукта "High-Low Divergence [Iridio Capital]"](https://cdn.ctrader.com/image/webp/443c4661-7abb-40f1-842f-4b6ec560649b_40914)


