
Описание
📌 Описание для магазина cTrader – Французский 🇫🇷
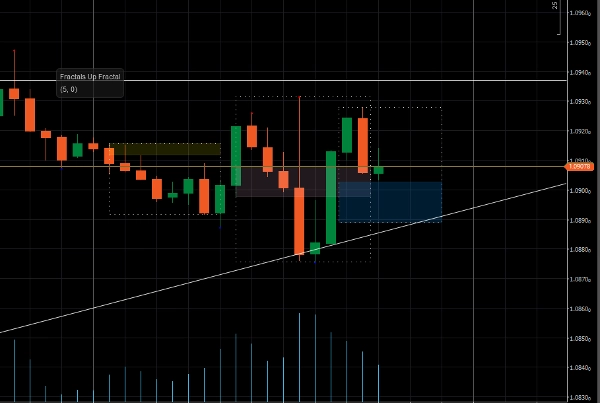
🔍 Индикатор [LDE] OPR & Market Sessions – Чёткая визуализация сессий!
Этот индикатор выделяет основные рыночные сессии (Токио, Лондон, Нью-Йорк), отображая динамические прямоугольники на вашем графике.
✔ Настраиваемое отображение сессий 🏙️
✔ Визуализация уровней High/Low по сессиям 📈
✔ Выделение диапазона открытой цены (OPR) ⏳
✔ Регулируемая прозрачность для лучшей читаемости 🎨
✔ Совместимость со всеми активами и таймфреймами ⏰
🔧 Гибкие настройки: включайте/выключайте каждую сессию, настраивайте цвета и персонализируйте отображение High/Low для каждой сессии.
🚀 Оптимизируйте свою торговлю, быстро выявляя ключевые зоны рынка!
📌 Description for cTrader Store – English 🇬🇧
🔍 [LDE] OPR & Market Sessions Indicator – Clear visualization of sessions!
This indicator highlights major market sessions (Tokyo, London, New York) by displaying dynamic rectangles on your chart.
✔ Customizable session display 🏙️
✔ Session-specific High/Low visualization 📈
✔ Highlighting of the Open Price Range (OPR) ⏳
✔ Adjustable transparency for better readability 🎨
✔ Compatible with all assets and timeframes ⏰
🔧 Flexible settings: enable/disable each session, adjust colors, and personalize the High/Low display for each session.
🚀 Optimize your trading by identifying key market zones at a glance!
Сводка
Отзывы покупателей
5 | 0 % | |
4 | 100 % | |
3 | 0 % | |
2 | 0 % | |
1 | 0 % |


