
Fisher_m11
Индикатор
1 покупки
Версия 1.0, Jul 2025
Windows, Mac
4.0
Отзывы: 1
Описание
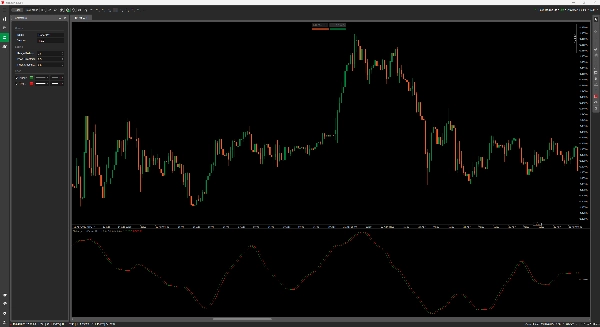
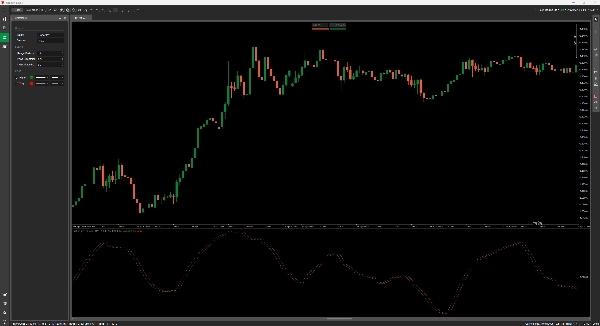
Fisher M11 – Превратите хаос в циклы
Мощный вариант преобразования Фишера, Fisher M11 помогает определять точки разворота и фильтровать шум, преобразуя ценовое движение в распределение, похожее на гауссово — обеспечивая чистые, читаемые сигналы на любом рынке.
Особенности:
- Двойная настройка линий: Fisher (зелёный) и Trigger (красный)
- Выделяет потенциальные развороты тренда и изменения импульса
- Полностью настраиваемый:
-
- Периоды диапазона: чувствительность к максимумам/минимумам
- Сглаживание цены: фильтрует резкие колебания цены
- Сглаживание индекса: контролирует реактивность сигнала
- Работает на любом таймфрейме и любом активе
Используйте его для подтверждения, тайминга или самостоятельных разворотных настроек.
Сводка
ИИ-сводка
Fisher M11 is an advanced indicator based on the Fisher Transform designed to identify turning points and filter noise in price data by converting price action into a Gaussian-like distribution. It features a dual-line setup with a Fisher line (green) and a Trigger line (red) to highlight potential trend reversals and momentum shifts. The indicator is fully adjustable, allowing users to customize range periods for sensitivity to highs and lows, price smoothing to reduce choppy movements, and index smoothing to control signal reactivity. Fisher M11 is compatible with any market, asset, and timeframe, making it suitable for use as a confirmation tool, timing aid, or standalone reversal setup.
Профиль индикатора
Отзывы покупателей
4.0
Отзывы: 1
5 | 0 % | |
4 | 100 % | |
3 | 0 % | |
2 | 0 % | |
1 | 0 % |
Отзывы покупателей
July 23, 2025
A first opinion needs more than one signal. It adds another angle without taking control.
Обсуждение
Частые вопросы
Продукты, доступные в cTrader Store, включая торговых ботов, индикаторы и плагины, предоставляются сторонними разработчиками и доступны исключительно в информационных и технических целях. cTrader Store не является брокером и не предоставляет инвестиционные консультации, персональные рекомендации или какие-либо гарантии будущей доходности.


![Логотип продукта "[Stellar Strategies] MARSI Signal Plotter"](https://cdn.ctrader.com/image/webp/7b2b8da6-8f8e-4646-8d4a-4710c516c01e_25567)


Цена
С 03/01/2025
638.03K
Торгуемый объем
21.34K
Выигранные пипы
15
Продажи