
RSI Advanced
Chỉ báo
1 lượt mua
Phiên bản 1.0, Apr 2026
Windows, Mac
5.0
Đánh giá: 1

Mô tả
Chỉ số Sức mạnh Tương đối (RSI) tiêu chuẩn là một trong những chỉ báo phổ biến nhất trên thế giới, nhưng việc vẽ một đường đơn ở dưới cùng biểu đồ của bạn là cách giao dịch lỗi thời. Nó khiến việc phát hiện các chuyển động động lực thực sự, gia tốc và sự dao động thị trường trở nên khó khăn.
The RSI Advanced hoàn toàn tái tạo bộ dao động cổ điển này. Bằng cách giới thiệu Đường Tín hiệu, Lọc Biến động và Vẽ Biểu đồ Thông minh, nó biến RSI thành một bảng điều khiển toàn diện, tất cả trong một cho động lực và theo dõi xu hướng.
Tính năng chính
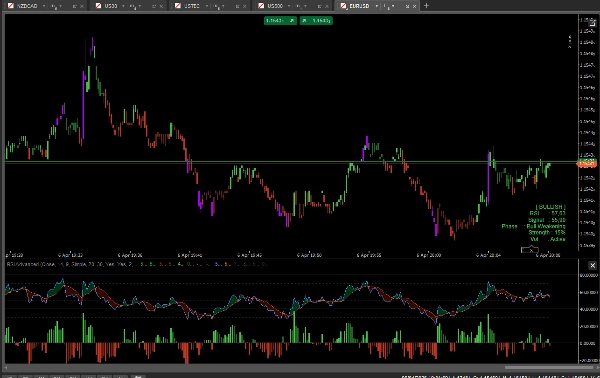
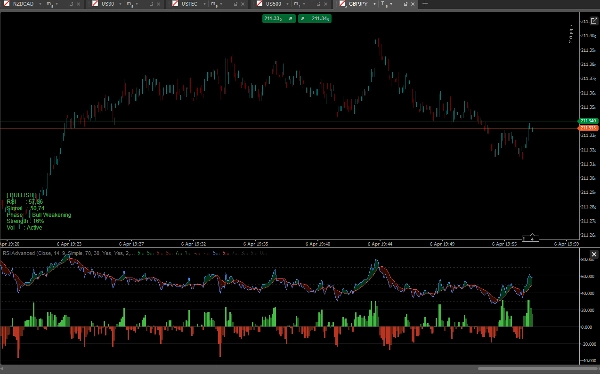
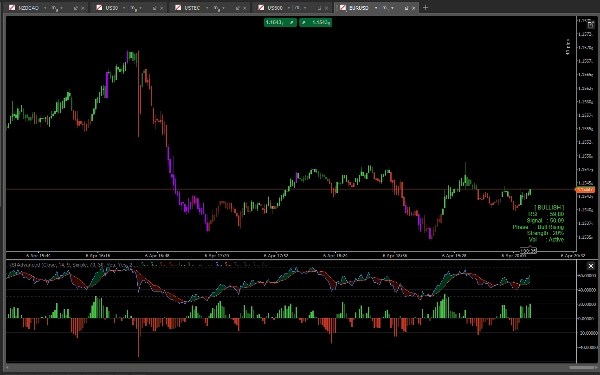
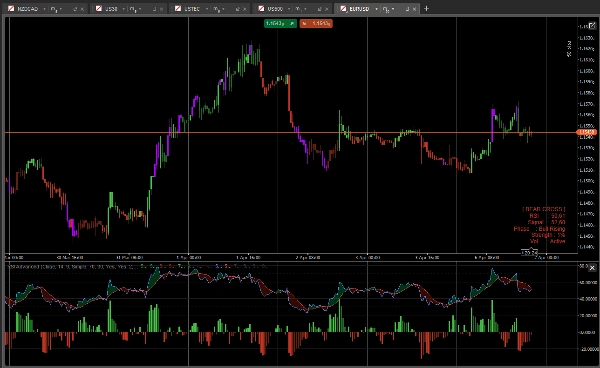
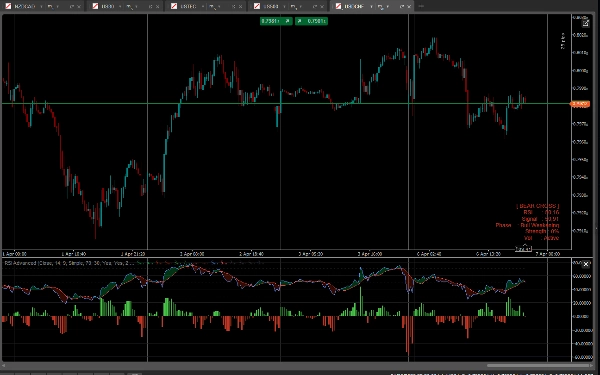
- RSI & Signal Cloud: Chúng tôi đã thêm một Đường Trung bình Động (Đường Tín hiệu) vào RSI. Khoảng cách giữa RSI và Đường Tín hiệu được lấp đầy bằng một Đám mây động. Nếu đám mây màu Xanh lá, phe Bò đang điều khiển động lực. Nếu nó màu Đỏ, phe Gấu đang kiểm soát.
- Biểu đồ Thanh Động lực: Một biểu đồ thanh tập trung theo dõi khoảng cách chính xác giữa RSI và Đường Tín hiệu. Với màu sắc gia tốc/giảm tốc tích hợp (sáng so với tối), bạn có thể dự đoán các điểm giao cắt và sự cạn kiệt động lực trước khi chúng xảy ra.
- Tô màu Thanh Thông minh (Paintbars): Các cây nến của bạn sẽ thay đổi màu sắc dựa trên động lực RSI cơ sở:
-
- Xanh Lá Sáng/Đỏ Sáng: Sự đồng thuận mạnh mẽ của phe bò/gấu (RSI > 50 và RSI > Đường Tín hiệu).
- Xanh Lá Tối/Đỏ Tối: Động lực yếu hoặc sự điều chỉnh.
- Tím/Magenta: Mức Quá Mua (OB) hoặc Quá Bán (OS) cực đoan – cảnh báo bạn về khả năng đảo chiều.
- Bộ Lọc Biến động Thông minh (ATR): Mệt mỏi vì bị dao động trong thị trường phẳng? Bật bộ lọc ATR tích hợp. Khi biến động giảm xuống dưới mức trung bình lịch sử của bạn, các cây nến và biểu đồ thanh chuyển sang màu xám, giúp bạn tránh các giao dịch xấu.
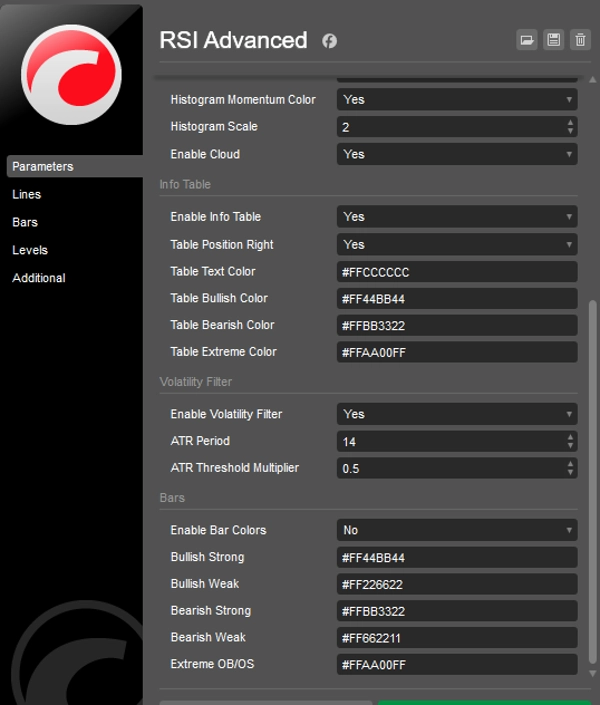
- Bảng Thông tin Trên Biểu đồ: Một bảng dữ liệu gọn gàng hiển thị các chỉ số thời gian thực: giá trị chính xác của RSI và Đường Tín hiệu, Giai đoạn Động lực, Phần trăm Độ mạnh Xu hướng và Trạng thái Biến động.
- Hoàn toàn Mở khóa: Giao dịch trên BẤT KỲ ký hiệu nào (Forex, Crypto, Chỉ số, Cổ phiếu) và BẤT KỲ khung thời gian nào mà không giới hạn. Truy cập trọn đời.
Cách giao dịch với nó?
- Tiếp tục Xu hướng: Tìm các đợt điều chỉnh mà RSI vẫn ở trên Đường Giữa 50, nhưng hơi giảm xuống Đường Tín hiệu. Khi Biểu đồ Thanh gia tốc (xanh lá sáng) và các cây nến chuyển sang xanh lá sáng, đó là điểm vào lệnh tiếp tục mạnh mẽ.
- Đảo chiều: Khi các cây nến chuyển sang màu Tím (OB/OS cực đoan), hãy chờ RSI cắt trở lại Đường Tín hiệu (Đám mây đổi màu) để có thiết lập đảo chiều có xác suất cao.
- Tránh dao động: Nếu Bộ Lọc Biến động làm các thanh của bạn chuyển sang màu xám, hãy ngồi yên và chờ thị trường tỉnh lại.
Tóm tắt
Hồ sơ chỉ báo
Danh mục chỉ báo
Biến động
Loại đầu ra
Bộ lọc
Yêu cầu dữ liệu
Chỉ dữ liệu nến
Tín hiệu được hỗ trợ
Giao cắt
Sức mạnh xu hướng
Biến động
Đánh giá của khách hàng
5.0
Đánh giá: 1
5 | 100 % | |
4 | 0 % | |
3 | 0 % | |
2 | 0 % | |
1 | 0 % |
Đánh giá của khách hàng
April 11, 2026
The first thing that worked was timing feels less random, and a small account test feels safer.
Thảo luận
Câu hỏi thường gặp
BTCUSD
Forex
Signal
Indices
EURUSD
Commodities
GBPUSD
NZDUSD
RSI
AI
XAUUSD
NAS100
ATR
USDJPY
Các sản phẩm có sẵn trên cTrader Store, bao gồm bot giao dịch, chỉ báo và plugin, được cung cấp bởi các nhà phát triển bên thứ ba và chỉ nhằm mục đích cung cấp thông tin và tiếp cận kỹ thuật. cTrader Store không phải là nhà môi giới và không cung cấp lời khuyên đầu tư, khuyến nghị cá nhân hay bất kỳ đảm bảo nào về hiệu suất trong tương lai.


Giá
24
Lượt bán
662
Cài đặt miễn phí