Описание
HCCC MTF - Композитный канал цикла Херста (100% БЕСПЛАТНО)
Обзор
HCCC MTF (Композитный канал цикла Херста) — это продвинутая, полностью интерактивная панель Multi-Timeframe (MTF) и индикатор канала. Основанный на циклических теориях Дж.М. Херста в сочетании с волатильностью ATR, этот инструмент помогает вам определить истинный рыночный тренд и идеальные циклические точки разворота (вершины и впадины) одновременно на нескольких таймфреймах.
Второй посвящён полуавтоматической торговле с https://ctrader.com/products/3618?u=cLogic
ВАЖНО: Этот индикатор полностью 100% БЕСПЛАТЕН для всех. Он был специально разработан как идеальный визуальный помощник для cBot "Follow The Trend XAU Edition".
Хотя вы можете использовать его идеально для ручной торговли, его истинная сила раскрывается при использовании в полуавтоматическом режиме: вы используете панель HCCC для чтения цикла и импульса на старших таймфреймах, а затем включаете cBot Follow The Trend XAU Edition для точного исполнения и управления сделками в этом направлении.
Ключевые особенности
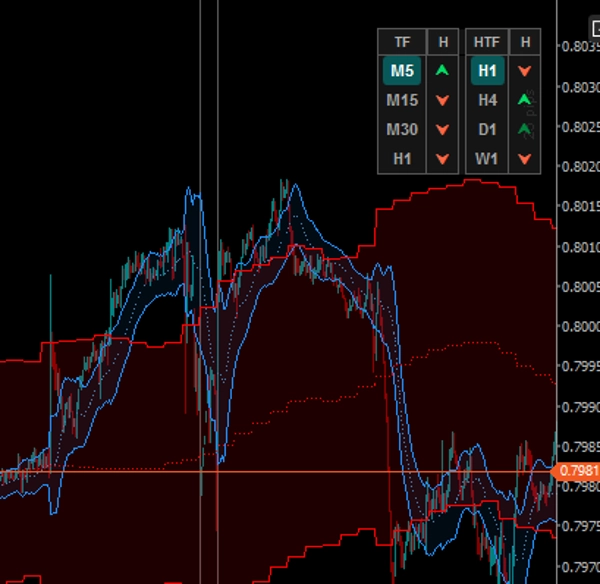
1. Интерактивная панель MTF (кликабельная)
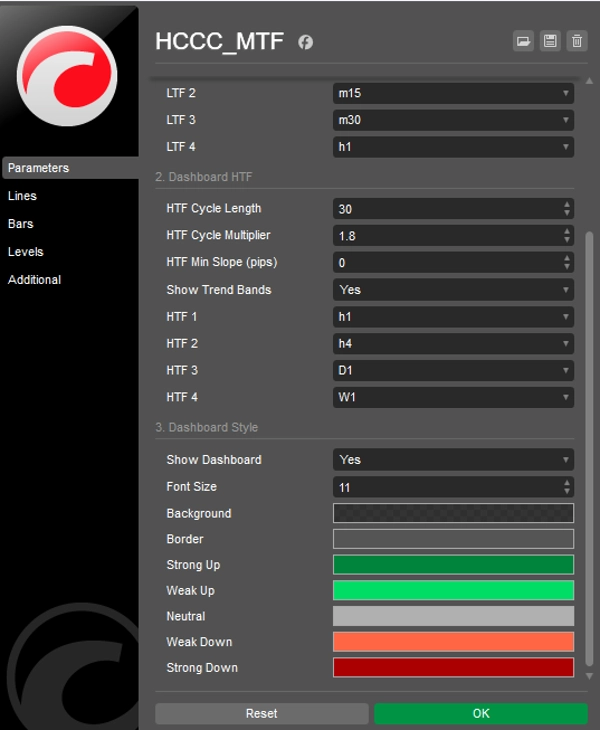
Забудьте о переключении между графиками. Панель на графике отслеживает 4 младших таймфрейма (LTF) и 4 старших таймфрейма (HTF).
- Кнопки LTF: Нажмите любую кнопку LTF, чтобы мгновенно изменить таймфрейм текущего графика.
- Кнопки HTF: Нажмите любую кнопку HTF, чтобы мгновенно отобразить канал выбранного старшего таймфрейма прямо на вашем текущем графике!
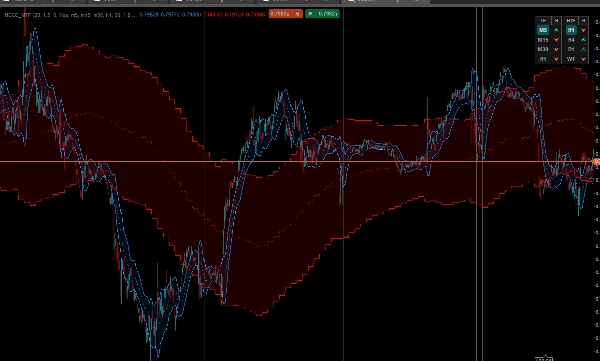
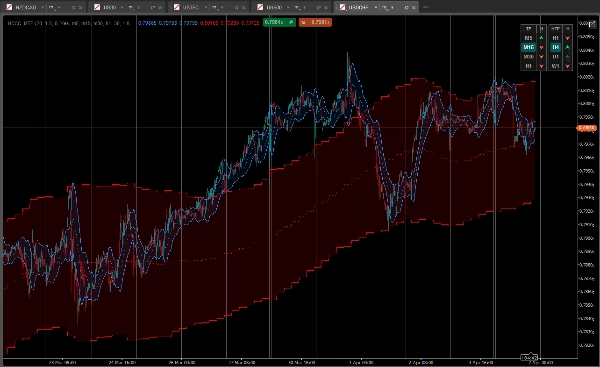
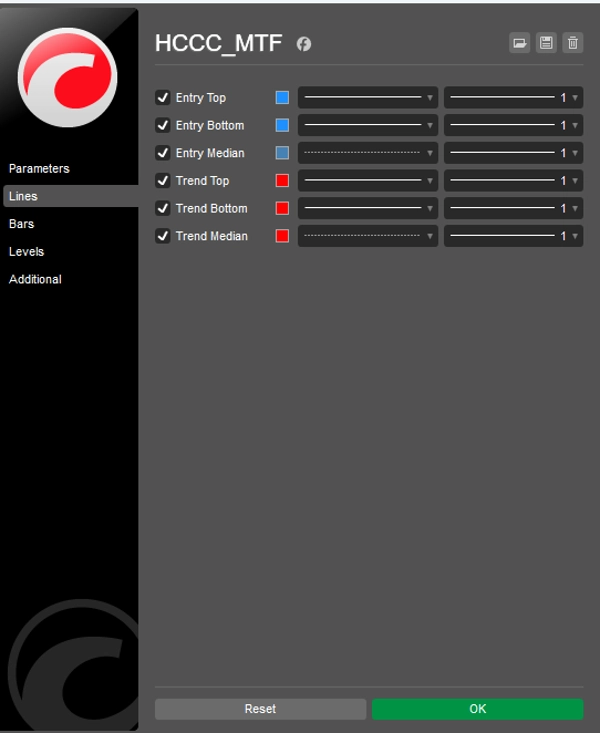
2. Система наложения двойного канала
Индикатор строит два элегантных, заполненных облаками канала на вашем графике одновременно:
- Цикл входа (синее облако): Рассчитывает цикл Херста на основе таймфрейма вашего текущего графика.
- Цикл тренда (красное облако): Макро-канал, рассчитанный из выбранного вами старшего таймфрейма на панели.
3. Продвинутые циклические сигналы с 5 состояниями
Панель показывает не только направление тренда; она отображает фазу цикла, анализируя наклон медианной линии и положение цены относительно полос ATR.
- [ ⮝ ] Тёмно-зелёный (Сильная покупка): Наклон медианы ВВЕРХ, и цена опустилась к нижней полосе. Это циклическая впадина (покупайте на падении).
- [ ⮝ ] Светло-зелёный (Слабая покупка): Тренд ВВЕРХ, но цена колеблется около медианы или верхней полосы.
- [ — ] Серый (Нейтральный): Цикл плоский. Нет явного импульса.
- [ ⮟ ] Светло-красный (Слабая продажа): Тренд ВНИЗ, но цена близка к медиане.
- [ ⮟ ] Тёмно-красный (Сильная продажа): Наклон медианы ВНИЗ, и цена поднялась к верхней полосе. Это циклический пик (продавайте на росте).
Как использовать с cBot "Follow The Trend XAU Edition"?
- Посмотрите на правую сторону панели (столбец HTF). Подождите явного совпадения на старших таймфреймах (например, H4 и D1 показывают стрелки тёмно/светло-зелёного цвета).
- Посмотрите на левую сторону панели (столбец LTF), чтобы найти локальную коррекцию (например, M15 показывает тёмно-зелёную стрелку "Сильная покупка").
- Когда логика MTF совпадёт, активируйте ваш cBot Follow The Trend XAU Edition в направлении "ПОКУПКА" и позвольте его алгоритмам управлять входом, трейлинг-стопами и управлением рисками.
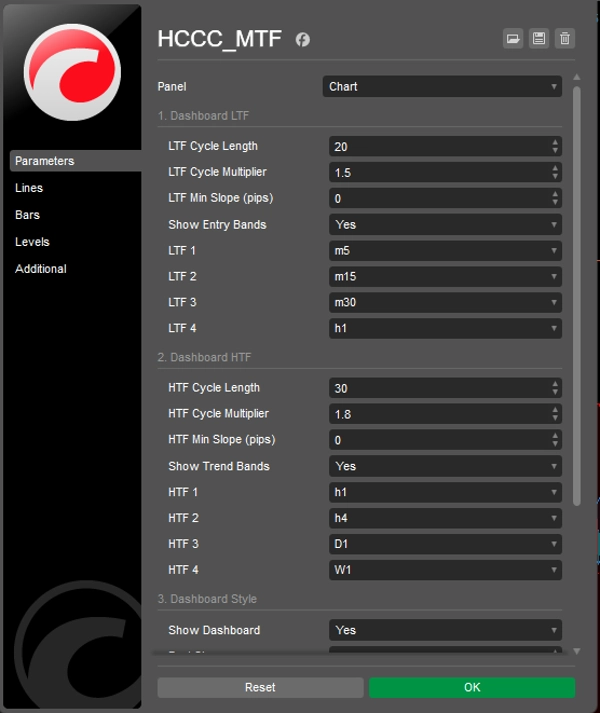
Настройка
Всё полностью настраивается: длины циклов, множители ATR, минимальная чувствительность наклона (в пипсах) для фильтрации шума, а также полный контроль над цветами и расположением интерфейса.
Скачайте его сейчас БЕСПЛАТНО и поднимите вашу полуавтоматическую торговлю на новый уровень!
Сводка
It overlays two cloud-filled channels: a blue "Entry Cycle" channel based on the current timeframe and a red "Trend Cycle" channel derived from a selected higher timeframe. The dashboard provides advanced five-state cyclic signals indicating strong or weak buy/sell conditions and neutral phases by analyzing the slope of the median line and price position relative to ATR bands.
The indicator is fully customizable, including cycle lengths, ATR multipliers, slope sensitivity, and UI appearance. It is intended to complement the "Follow The Trend XAU Edition" cBot by providing visual cycle and momentum analysis to guide semi-automated trade execution and management. The HCCC MTF supports various markets including Forex, commodities, indices, stocks, and cryptocurrencies.