
DynamicVolumeSupplyDemand
Индикатор
1.29K скачивания
Версия 1.0, Apr 2025
Windows, Mac
4.2
Отзывы: 5
Описание
Представляем динамические зоны спроса и предложения от AlgoAlpha, воссозданные мной для платформы Ctrader. Этот индикатор предназначен для автоматического определения и визуализации динамических зон спроса и предложения на вашем графике, помогая трейдерам выявлять потенциальные области разворота и оценивать рыночные настроения с повышенной ясностью. Он адаптируется к рыночным условиям с помощью динамического механизма обратного просмотра, что делает его более отзывчивым к последним движениям цены. 📈💡
Ключевые особенности
- 📊 Динамический обратный просмотр: Автоматически регулирует период обратного просмотра на основе самого последнего поворотного пункта, обеспечивая анализ наиболее релевантных данных.
- 🎯 Обнаружение поворотных точек: Использует заданный пользователем период для выявления значимых локальных максимумов и минимумов, точно отмечая потенциальные точки разворота.
- 🛠 Настраиваемые параметры: Предлагает широкие возможности настройки, включая период обратного просмотра, чувствительность обнаружения поворотов, разрешение и допуск зон.
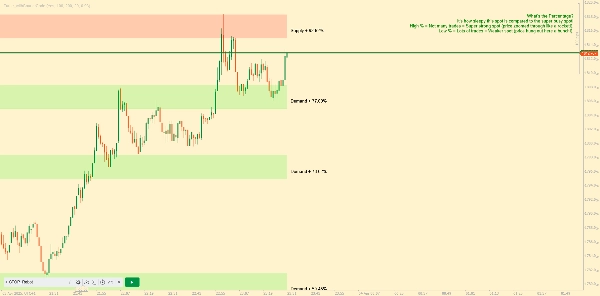
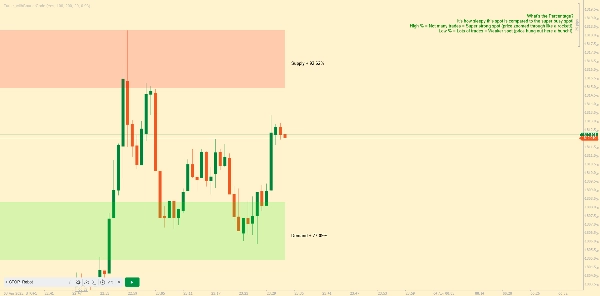
- 🗺 Визуальное отображение: Отображает зоны спроса и предложения в виде прямоугольников на графике, с выделением фона для различения бычьих и медвежьих зон.
- 🖍 Цветовое кодирование зон: Зоны окрашены для удобства идентификации: зеленый для бычьих, красный для медвежьих и серый для нейтральных уровней.
Сводка
ИИ-сводка
DynamicVolumeSupplyDemand is an indicator for the cTrader platform that automatically identifies and visualizes dynamic supply and demand zones on trading charts. It helps traders locate potential reversal areas and evaluate market sentiment by adapting to recent price movements through a dynamic look-back mechanism. Key features include:
- Dynamic Look-Back: Automatically adjusts the look-back period based on the latest pivot points to analyze the most relevant data.
- Pivot Point Detection: Uses a user-defined period to detect significant pivot highs and lows, marking potential reversal points.
- Customizable Parameters: Allows adjustment of look-back period, pivot detection sensitivity, resolution, and zone tolerance.
- Visual Display: Presents supply and demand zones as boxes on the chart with background highlighting to distinguish bullish and bearish zones.
- Color-Coded Zones: Zones are color-coded for clarity—green for bullish, red for bearish, and gray for neutral levels.
This indicator supports enhanced clarity in market analysis by dynamically adapting to changing market conditions and providing clear visual cues for supply and demand levels.
Профиль индикатора
Отзывы покупателей
4.2
Отзывы: 5
5 | 40 % | |
4 | 40 % | |
3 | 20 % | |
2 | 0 % | |
1 | 0 % |
Отзывы покупателей
October 12, 2025
Could you please make a new indicator so too remove the explanation and how the indicator works written on the chart? Very nice indicator otherwise!
August 12, 2025
Pros: Identifies dynamic supply and demand zones based on volume. Flexible settings, strong visual clarity. Cons: No alerts or tooltips. Lacks history of previous zones and user template saving.
May 15, 2025
This indicator finds the supply and demand areas very well but it has a problem. But the explanation and how the indicator works written on the chart is very annoying. I hope the designer of this software will solve this problem. Thank you
Обсуждение
Частые вопросы
Продукты, доступные в cTrader Store, включая торговых ботов, индикаторы и плагины, предоставляются сторонними разработчиками и доступны исключительно в информационных и технических целях. cTrader Store не является брокером и не предоставляет инвестиционные консультации, персональные рекомендации или какие-либо гарантии будущей доходности.


Цена
С 09/01/2025
11.78K
Бесплатные установки