
True Trend H4
Индикатор
2 покупки
Версия 1.0, Jun 2025
Windows, Mac
4.0
Отзывы: 1
Описание
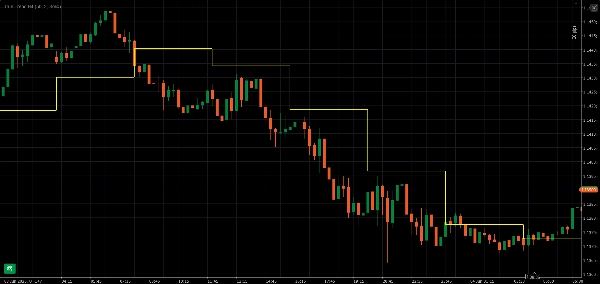
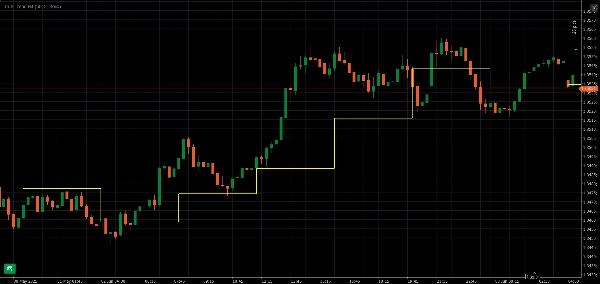
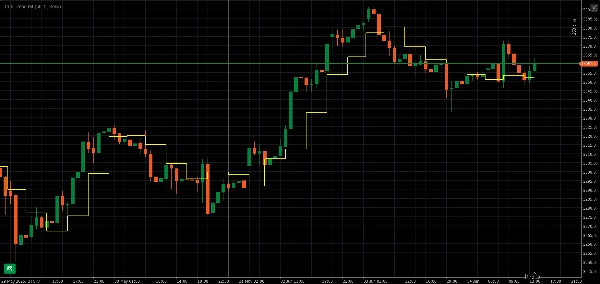
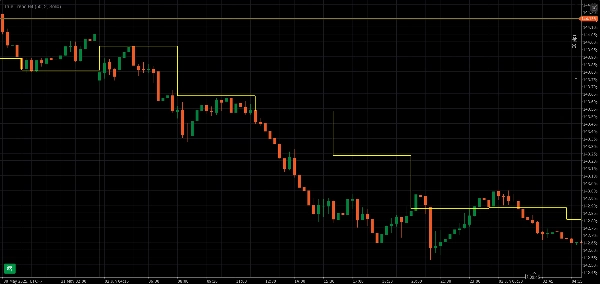
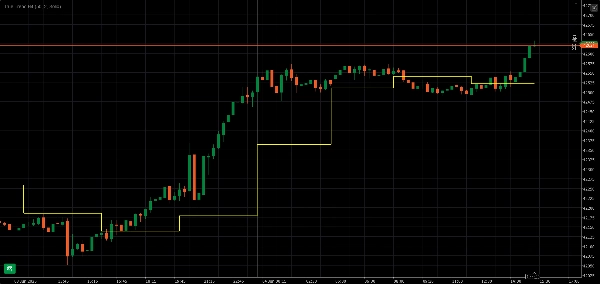
Индикатор True Trend H4 использует ступенчатую линию, чтобы четко показать направление тренда на H4. Вы можете хорошо видеть это на меньших таймфреймах, таких как M1, M5, M15, M30 и H1.
Сводка
Профиль индикатора
Отзывы покупателей
4.0
Отзывы: 1
5 | 0 % | |
4 | 100 % | |
3 | 0 % | |
2 | 0 % | |
1 | 0 % |
Отзывы покупателей
June 7, 2025
The signal still needs a chart check, no surprise there. A 5 minute check should not become a 30 minute rabbit hole.
Обсуждение
Частые вопросы
Продукты, доступные в cTrader Store, включая торговых ботов, индикаторы и плагины, предоставляются сторонними разработчиками и доступны исключительно в информационных и технических целях. cTrader Store не является брокером и не предоставляет инвестиционные консультации, персональные рекомендации или какие-либо гарантии будущей доходности.


![Логотип продукта "[Stellar Strategies] Inside Bar with Signals"](https://cdn.ctrader.com/image/webp/1d9e8bfa-3b2c-4440-bb37-5856902008a7_30683)


![Логотип продукта "[Stellar Strategies] MARSI Signal Plotter"](https://cdn.ctrader.com/image/webp/7b2b8da6-8f8e-4646-8d4a-4710c516c01e_25567)


Цена
С 28/05/2025
69.61M
Торгуемый объем
391.92K
Выигранные пипы
2
Продажи