
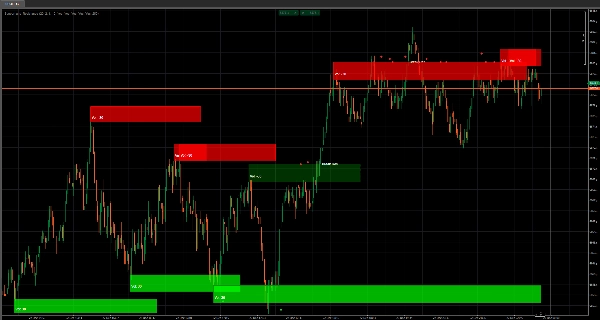
✅ Коробки поддержки и сопротивления с высоким объемом — автоматически отображают реальные зоны «отбой / пробой»
✅ Прочность зоны с учетом объема (динамическая прозрачность) — чем больше объем, тем сильнее присутствие коробки
✅ Создание зон на основе пивотов (Lookback) — в зоны попадают только подтвержденные уровни (меньше шума)
✅ Адаптивная ширина коробки (на основе ATR) — зоны масштабируются под текущую волатильность, а не фиксированные догадки
✅ Живое расширение коробок — зоны продолжают проецироваться вперед по мере изменения цены
✅ Интеллект пробоя / удержания — определяет, когда зона удерживается или пробивается, и мгновенно реагирует
✅ Визуальные метки событий (ромбы) — четкие подтверждения «удержания / разворота» без лишних размышлений
✅ Метки пробоя — четкие события «пробой поддержки / пробой сопротивления» на графике
✅ Полный визуальный контроль — переключатели для коробок / текста объема / ромбов / меток пробоя
✅ Система автоочистки — предотвращает захламление графика, автоматически удаляя старые метки событий
✅ Контроль максимального количества коробок — жесткое ограничение для поддержания высокой производительности и читаемости графиков
Поддержка и сопротивление (коробки с высоким объемом) — это не базовый инструмент S/R, который рисует случайные линии.
Этот индикатор создан, чтобы показать вам нечто гораздо более ценное:
Где цена создала реальный интерес — и где она с наибольшей вероятностью отреагирует снова.
Вместо того чтобы рисовать «красивые уровни», он строит зоны спроса и предложения с высоким объемом в виде коробок прямо на вашем графике, чтобы вы могли торговать структурой как профессионал:
определить зону → наблюдать реакцию → торговать удержание или пробой.
Основное преимущество: объем + структура, а не догадки
Каждая коробка создается только при совпадении двух условий:
- Подтвержденный пивот (структура имеет значение)
- Экстремум объема (интерес имеет значение)
Это значит, что вы не получаете спам из слабых зон.
Вы получаете меньше зон — но те, что получаете, действительно важны.
Прочность, которую видно (прозрачность = сила)
Вот где становится несправедливо для тех, кто торгует «вслепую» по S/R.
Прозрачность заливки коробки масштабируется в зависимости от объема, так что вы сразу понимаете:
- Слабая коробка = низкий интерес (следите за ней)
- Сильная коробка = высокий интерес (уважайте её)
Без дополнительных индикаторов, без интерпретационных гимнастик — это буквально видно.
Адаптивные зоны по волатильности (ширина ATR)
Рынки не движутся одинаково каждый день.
Этот индикатор адаптирует толщину коробки, используя долгосрочную базу ATR, так что зоны расширяются или сжимаются вместе с волатильностью.
Результат:
зоны остаются реалистичными вместо того, чтобы быть слишком тонкими, чтобы иметь значение, или слишком широкими и бесполезными.
Интеллект удержания и пробоя (и мгновенная визуальная обратная связь)
Зона ценна только тогда, когда вы можете прочитать, что с ней делает цена.
Этот индикатор отслеживает:
- Удержания (отбой / уважение)
- Пробои (пробитие зоны)
…а затем обновляет стиль в реальном времени:
- Удержания сохраняют исходную «идентичность поддержки/сопротивления»
- Пробои меняют поведение (поддержка может стать сопротивлением и наоборот)
- Стиль пробоя может переключаться на пунктирный + новый цветовой тон, чтобы вы сразу знали:
«Этот уровень только что изменил характер.»
Ромбы + метки пробоя: четкие триггеры для принятия решений
Вы получаете простые маркеры событий с высоким сигналом:
- Ромбы для выделения событий удержания/разворота
- Метки пробоя чтобы вы никогда не пропустили момент, когда уровень ломается
Это разница между думать, что что-то пробилось… и знать, что оно пробилось.
Создан для реальной торговли: контроль + чистые графики
Этот индикатор разработан так, чтобы оставаться удобным после часов торговли:
- Хотите только зоны? Выключите ромбы/метки.
- Хотите чистые сигналы? Выключите текст объема.
- Хотите производительность? Ограничьте Максимальное количество коробок.
- Ненавидите захламленность? Автоочистка событий поддерживает график в порядке, автоматически удаляя старые метки.
Вы сосредоточены на текущей битве — а не утопаете в истории.
Рекомендуемые настройки (быстрый старт)
✅ Период Lookback: 20 (сбалансированное подтверждение)
✅ Длина фильтра объема: 2 (отзывчивый)
✅ Множитель ширины коробки: 1.0 (нейтральный)
✅ Показывать коробки: ВКЛ
✅ Ромбы + метки пробоя: ВКЛ (пока не изучите поведение, затем уточните)
✅ Автоочистка событий: ВКЛ (держите график чистым)
Что этот индикатор действительно дает вам
Визуальную карту где рынок показал свои намерения — и живое чтение о том, уважает ли цена эту зону или разрушает её.
Если вы торгуете пробои, откаты, развороты или ретесты:
это станет вашим «наложением поля боя».


