
설명
✅ 고급 피벗 논리를 사용하여 높고 낮은 확률의 전환점을 감지합니다
✅ 완전히 사용자 정의 가능한 깊이, 편차 및 백스텝 엔진
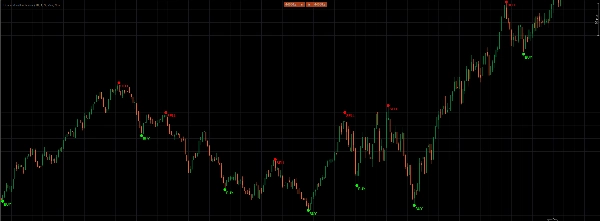
✅ 차트에 명확한 매수 및 매도 라벨을 자동으로 표시합니다
✅ 추가 명확성을 위한 선택적 피벗 마커 및 현재 바 하이라이트
✅ 정밀하고 자신감 있게 초기 반전을 포착하도록 설계되었습니다
정밀한 거래를 가능하게 하는 매수 및 매도 지표: 사용자 정의 가능한 깊이, 편차 및 백스텝 설정을 사용하여 고확률 및 저확률 전환점을 감지하는 강력한 피벗 기반 신호 엔진입니다. DepthEngine, DeviationEngine 및 BackstepEngine을 구성하여 민감도를 미세 조정한 다음, 지표가 자동으로 명확한 “BUY” 및 “SELL” 라벨을 표시하도록 하세요—선호하는 색상의 선택적 피벗 및 현재 바 마커와 함께—그래서 다시는 추세 반전을 놓치지 않을 것입니다! 더 똑똑하게 거래하세요, 더 열심히가 아니라.
요약
AI 요약
The Buy and Sell Indicator is a pivot-based trading tool designed to identify high- and low-probability market turning points. It uses customizable Depth, Deviation, and Backstep engines to adjust sensitivity and precision in detecting trend reversals. Once configured, the indicator automatically plots clear "BUY" and "SELL" labels on the chart, with optional pivot markers and current-bar highlights for enhanced visual clarity. This indicator supports multiple markets including Forex, indices, commodities, stocks, and cryptocurrencies. It aims to assist traders in capturing early reversals by providing precise entry and exit signals based on advanced pivot logic. The tool integrates features relevant to various trading strategies such as breakout, scalping, and smart money concepts, and complements other indicators like RSI, MACD, Bollinger Bands, and Fibonacci levels.
지표 프로필
고객 리뷰
4.3
리뷰: 3
5 | 33 % | |
4 | 67 % | |
3 | 0 % | |
2 | 0 % | |
1 | 0 % |
고객 리뷰
July 13, 2025
Helpful second opinion for traders who combine signals before acting. It gives value around chart reading, but it should not be used as a blind entry trigger. The cleaner reads should hold across 3 sessions, not just 1 good chart. It is stronger when a 1.5R target is realistic before the entry.
July 12, 2025
July 12, 2025
Worth a demo run for chart reading. it makes market context easier to scan, especially when used for adding confirmation before a trade. I would test it on 2 timeframes, 20 signals and a 1R stop plan. It is stronger when a 1.5R target is realistic before the entry.
상담
자주 묻는 질문(FAQ)
Forex
Signal
Breakout
Indices
Commodities
RSI
Martingale
Bollinger
Fibonacci
Prop
ZigZag
Scalping
Supertrend
Fair Value Gap
SMC
Crypto
Grid
Stocks
AI
ATR
MACD
VWAP
트레이딩 봇, 지표, 플러그인 등 cTrader Store에서 제공되는 상품은 제3자 개발자에 의해 제공되며, 이는 단순히 정보 및 기술적 접근을 목적으로 제공된 것입니다. cTrader Store는 중개인이 아니며, 투자 조언, 개인별 추천 또는 향후 성과에 대한 어떠한 보장도 제공하지 않습니다.
이 작성자의 상품 더 보기


좋아하실 만한 다른 항목


가격
60
판매
935
무료 설치