Descrição
Index Hunter: Visão Geral
Index Hunter é um indicador técnico especializado e sistema de suporte à decisão projetado principalmente para índices de alta volatilidade como US30 (Dow Jones) e NAS100 (Nasdaq). Diferente dos indicadores padrão que apenas mostram dados passados, o Index Hunter foca em "Previsão Vetorial"—tentando projetar onde o preço provavelmente estará 4 velas à frente com base na velocidade atual (inclinação) em múltiplos períodos de tempo.
1. Mecânica Principal (Como Funciona)
A. O Motor de Previsão "Vetorial"
Este é o coração da ferramenta. Ele não apenas observa o preço atual; calcula a taxa de variação (Inclinação) nos períodos M5, M15 e H1 para desenhar um "Caminho Futuro" no seu gráfico.
- Mecânica: Calcula uma média ponderada do momentum de diferentes períodos para projetar 4 pontos (P1, P2, P3, P4) no futuro.
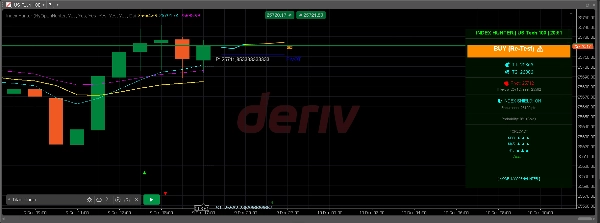
- Visual: Você vê um caminho colorido (Ciano -> Amarelo -> Laranja) se estendendo à direita do preço, visualizando a inércia do mercado.
- Caminho Fantasma: Também lembra a previsão anterior (Caminho Fantasma) para que você possa ver se o mercado está respeitando as projeções passadas do algoritmo (uma "verificação de realidade").
B. Sistema Visual Multi-Camadas
Ele sobrepõe automaticamente níveis institucionais críticos:
- Pontos de Pivot (Flexíveis): Calcula automaticamente os níveis Pivot, R1/S1 e R2/S2 com base em um período selecionável (H12, Diário, Dia2 ou Dia3).
- Níveis Psicológicos: Desenha "Linhas Psicológicas" a cada intervalo de 100 pontos (ex.: 34000, 34100), que frequentemente atuam como zonas magnéticas para índices.
- Máximo/Mínimo Diário: Marca a faixa do dia anterior para mostrar zonas de rompimento ou rejeição.
- Fractais: Identifica topos e fundos locais com setas (▲ ▼) para posicionamento preciso de entrada/stop-loss.
C. Lógica de "Confiança" e Viabilidade
A ferramenta não apenas dá um sinal; ela o classifica.
- Cálculo: Mede a distância até seu alvo de lucro e compara com a energia atual do mercado (ATR - Faixa Verdadeira Média).
- Resultado:
-
- QUENTE (>80%): Momentum forte + distância razoável ao alvo.
- MORNO (50-80%): Configuração moderada.
- FRIO (<50%): O mercado assume baixa probabilidade de alcançar o alvo (ex.: alvo muito distante para a volatilidade atual).
D. Mecânica do "Escudo" da Conta
Inclui um gestor de risco passivo no painel:
- Métrica de Resistência: Calcula quantos "pontos" o mercado pode se mover contra você antes que sua conta esteja em perigo, baseado no seu saldo e tamanho mínimo de lote.
- Status: Exibe "🛡️ ESCUDO DO ÍNDICE: LIGADO" se sua conta estiver segura em relação à volatilidade atual (ATR), ou "⚠️ MARGEM BAIXA" se a volatilidade estiver alta demais para seu saldo.
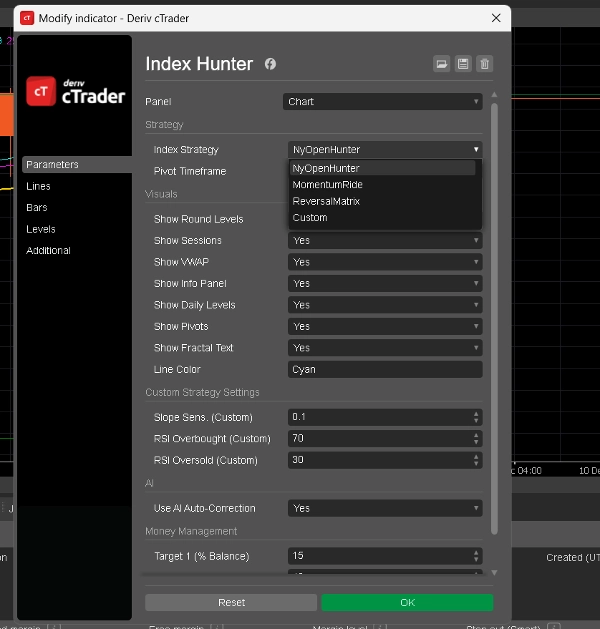
2. Modos Disponíveis (Estratégias)
Você pode alternar entre esses modos nas configurações do indicador (
Index Strategy
parâmetro). Cada modo altera como a IA interpreta o mercado.
1. Modo: NyOpenHunter (Scalper de Nova York)
- Melhor Para: As caóticas primeiras 2-3 horas da abertura do mercado dos EUA.
- Lógica:
-
- Horário Ativo: 13:00 - 17:00 UTC (aprox.).
- Gatilho: Procura uma Inclinação M5 maior que 0.1 (ou menor que -0.1).
- Filosofia: "Capture a explosão." Espera o surto inicial de volume no sino de NY e sinaliza para surfar essa onda específica.
- Sentimento do Painel: Mostra "NY OPEN BUY 🚀" ou "NY OPEN SELL 🔻".
2. Modo: MomentumRide (Seguidor de Tendência)
- Melhor Para: Tendências fortes e sustentadas fora da abertura.
- Lógica:
-
- Gatilho: Requer uma Inclinação M5 mais forte (> 0.2) do que o modo NY.
- Filosofia: "Não se deixe cortar." Ignora movimentos fracos e só sinaliza quando o mercado está se movendo com convicção significativa.
- Sentimento do Painel: Mostra "MOMENTUM UP 🟢" ou "MOMENTUM DOWN 🔴".
3. Modo: ReversalMatrix (Contra-Tendência)
- Melhor Para: Mercados laterais ou para capturar topos/fundos.
- Lógica:
-
- Gatilho: Usa RSI (Índice de Força Relativa).
-
- Sinal de Venda: RSI > 75 (Sobrecomprado).
- Sinal de Compra: RSI < 25 (Sobrevendido).
- Filosofia: "Aproveite os extremos." Identifica quando o elástico está esticado demais e provavelmente vai voltar.
- Sentimento do Painel: "SOBRECOMPRADO (VENDA EM BREVE)" ou "SOBREVENDIDO (COMPRA EM BREVE)".
4. Modo: Custom (Definido pelo Usuário)
- Melhor Para: Usuários avançados que querem ajustar o bot.
- Lógica: Permite definir seus próprios limites para Sensibilidade da Inclinação e níveis de RSI nas configurações.
-
- Exemplo: Você pode criar uma estratégia híbrida que só compra se a Inclinação > 0.05 E RSI < 40.
3. O "Painel de Informações" (Display de Cabeçalho)
O painel visual no lado direito do gráfico consolida todos esses dados:
- Cabeçalho: Mostra o modo atual e o símbolo.
- Preferência: O viés principal da IA (ex.: "BUY 34150 ▲").
- Alvos (T1, T2): Alvos de lucro dinâmicos calculados com base nas configurações percentuais da sua conta e volatilidade.
- Previsão: Uma análise sequencial das tendências M30, M45 e H1 (ex.: "M30: ▲ ▲ ▲" significa forte alinhamento de compra).
- Probabilidade: A pontuação de confiança da IA (Quente/Morno/Frio).
Resumo
Key features include an automatic overlay of institutional levels such as pivot points (with selectable timeframes), psychological price levels at 100-point intervals, previous day’s high/low, and fractals marking local tops and bottoms. It incorporates a confidence grading system (Hot, Warm, Cold) based on momentum strength and volatility relative to profit target distance.
Index Hunter includes a risk management "Shield" that assesses account safety by calculating potential adverse market moves against account balance and lot size, displaying status alerts accordingly.
The indicator offers four operational modes: NyOpenHunter (New York market open scalping), MomentumRide (trend following), ReversalMatrix (counter-trend using RSI), and a Custom mode for user-defined slope and RSI thresholds. A comprehensive info panel consolidates mode, bias, dynamic targets, trend forecasts, and confidence scores for decision support.
Avaliações de clientes
5 | 67 % | |
4 | 33 % | |
3 | 0 % | |
2 | 0 % | |
1 | 0 % |