

说明
标准的相对强弱指数(RSI)是世界上最受欢迎的指标之一,但在图表底部绘制一条单线的交易方式已经过时。这使得识别真正的动量变化、加速和市场震荡变得困难。
RSI Advanced 完全重新定义了这一经典振荡器。通过引入信号线、波动率过滤和智能图表绘制,它将RSI转变为一个全面的、多合一的动量和趋势跟踪仪表盘。
主要特点
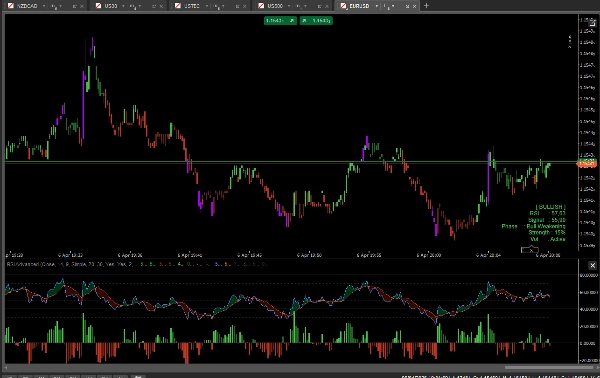
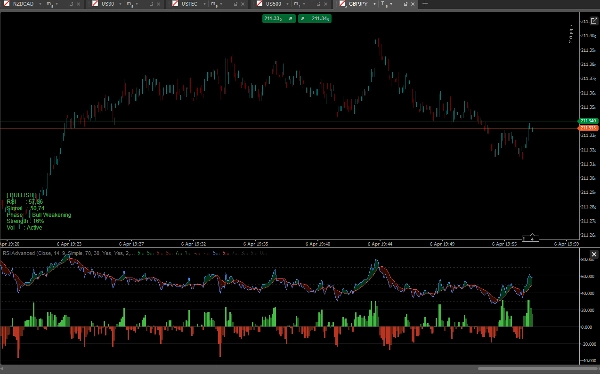
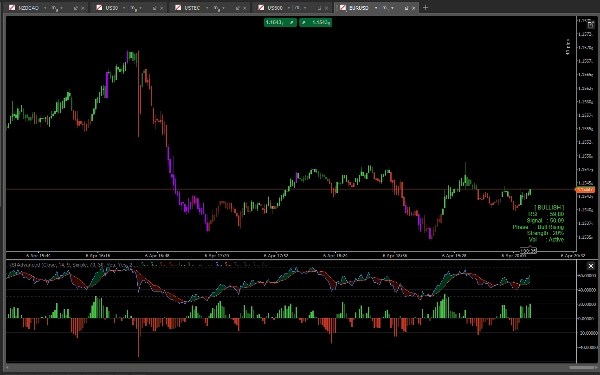
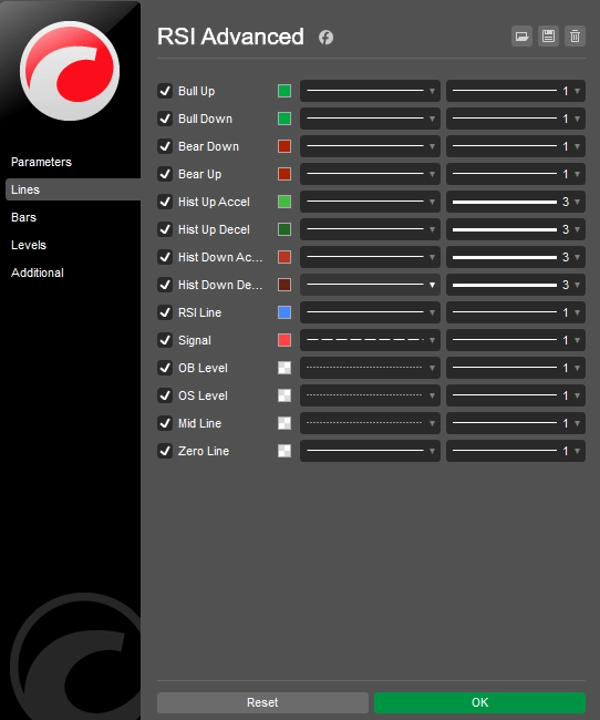
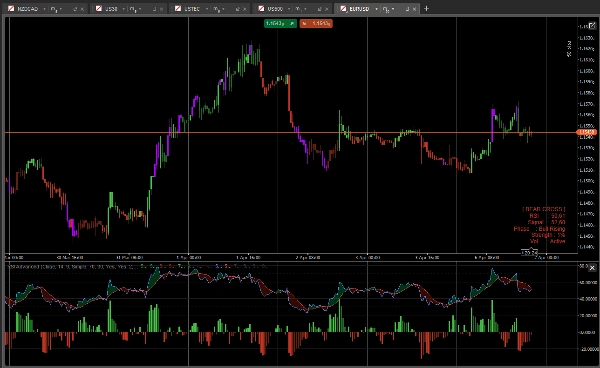
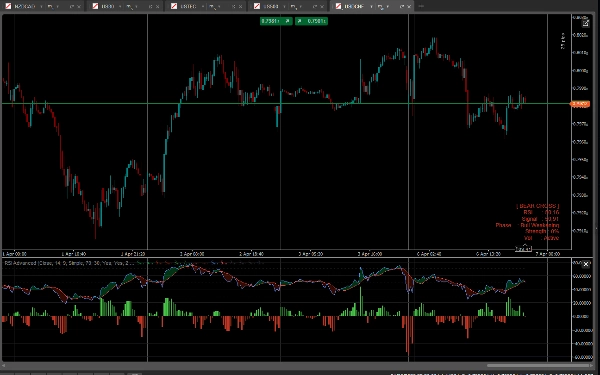
- RSI & 信号云: 我们为RSI添加了一个移动平均线(信号线)。RSI与其信号线之间的空间被动态云层填充。如果云层为绿色,表明多头主导动量;如果为红色,则空头控制市场。
- 动量直方图: 一个居中的直方图跟踪RSI与信号线之间的精确距离。内置的加速/减速颜色(明亮与暗色)让您能够在交叉和动量耗尽发生前预判。
- 智能柱状颜色(Paintbars): 您的蜡烛图将根据底层RSI动量改变颜色:
-
- 亮绿色/红色:强烈的多头/空头一致性(RSI > 50 且 RSI > 信号线)。
- 暗绿色/红色:动量较弱或回调。
- 紫色/品红色:极端超买(OB)或超卖(OS)水平——提醒您潜在的反转。
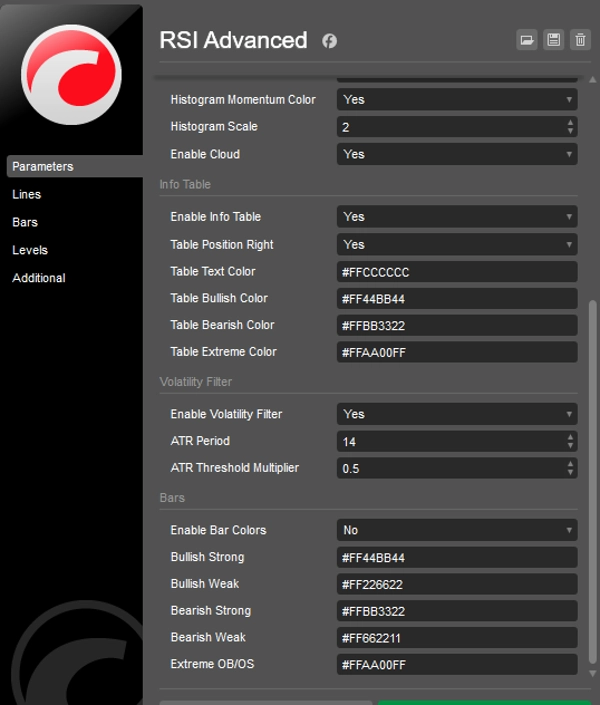
- 智能波动率过滤器(ATR): 厌倦了在盘整市场中被震荡?启用内置ATR过滤器。当波动率低于历史平均水平时,蜡烛和直方图会变灰,帮助您避免不良交易。
- 图表信息仪表盘: 一个简洁的数据面板显示实时指标:精确的RSI和信号值、动量阶段、趋势强度百分比和波动率状态。
- 完全解锁: 可在任何符号(外汇、加密货币、指数、股票)和任何时间框架上交易,无任何限制。终身访问权限。
如何使用它进行交易?
- 趋势延续: 寻找RSI保持在50中线以上但稍微下探至信号线的回调。当直方图加速(亮绿色)且蜡烛变为亮绿色时,这是一个强烈的延续入场信号。
- 反转: 当蜡烛变为紫色(极端超买/超卖)时,等待RSI重新穿越信号线(云层颜色变化),以获得高概率的反转设置。
- 避免震荡: 如果波动率过滤器使您的柱状变灰,只需静观其变,等待市场苏醒。
摘要
指标配置
指标分类
波动性
输出类型
过滤器
数据要求
仅 K 线
支持的信号
交叉
趋势强度
波动性
客户评价
5.0
评价:1
5 | 100 % | |
4 | 0 % | |
3 | 0 % | |
2 | 0 % | |
1 | 0 % |
客户评价
April 11, 2026
The first thing that worked was timing feels less random, and a small account test feels safer.
讨论
常见问答
BTCUSD
Forex
Signal
Indices
EURUSD
Commodities
GBPUSD
NZDUSD
RSI
AI
XAUUSD
NAS100
ATR
USDJPY
cTrader Store 提供的所有产品,包括交易机器人、指标和插件,均由第三方开发者提供,仅供信息参考和技术访问之用。cTrader Store 并非经纪商,不提供投资建议、个人推荐或任何未来业绩保证。


价格
24
销售
662
免费安装