


说明
TP_SL 非常有用的风险与回报工具(TradingView 风格)
将终极的 TradingView 风格多空头寸工具直接带到您的 cTrader 图表中!
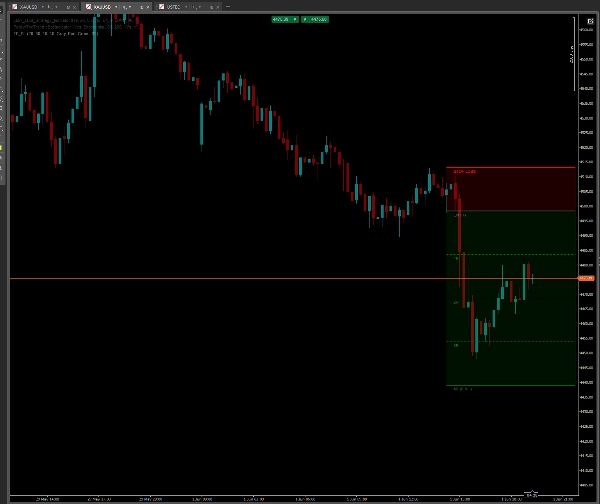
如果您曾经错过一个快速、直观且交互式的绘图工具来规划交易、计算风险并直观地预测获利水平,那么这个指标就是为您准备的。它设计注重速度和简洁的图表美学,允许您在不到一秒钟的时间内绘制出交易设置。
🔥 主要功能:
- cTrader 中的 TradingView 体验: 复制流行的视觉多空头寸工具。
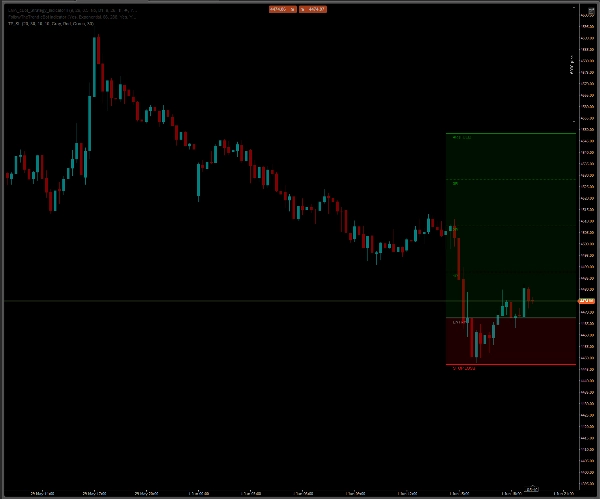
- 智能自动翻转(多头/空头): 无缝切换多头和空头头寸。只需将止损线拖动到入场线之上,获利区将立即翻转到下方。
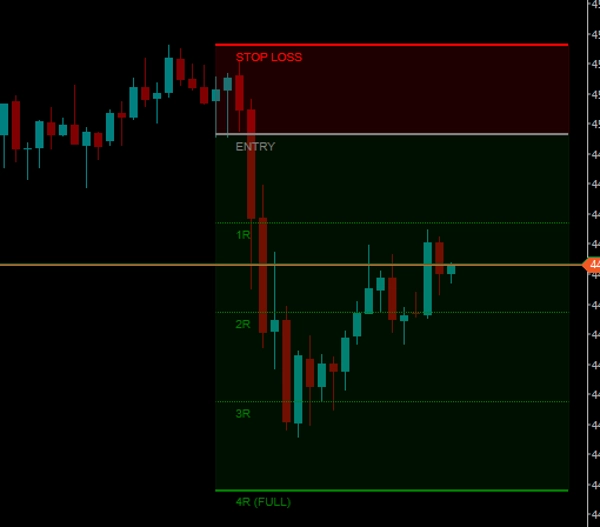
- 自动风险倍数(R 数学): 根据入场价与止损价之间的距离自动计算您的风险(1R),并动态预测 1R(无风险)、2R、3R 和 4R(完全获利)的精确获利水平。
- 简洁图表技术: 与无限向左延伸并杂乱历史数据的标准水平线不同,该工具使用有界线条。它创建了一个整洁、自包含的块,恰好停留在您需要的位置。
- 动态价格跟踪: 随着新蜡烛的出现,工具会自动“漂浮”到右侧,紧贴当前价格走势。
⚡ 使用方法:
- 绘制: 按住 SHIFT 键并在图表上任意位置 左键单击。设置将立即出现。
- 调整: 只需 拖放 灰色的“入场”线或红色的“止损”线到您想要的价格水平。整个网格会实时计算和调整。
- 删除: 点击入场线或止损线,然后按键盘上的 Delete 键。该指标具有自动清理功能,会立即删除整个绘图,保持图表整洁无杂乱。
⚙️ 完全可自定义设置:
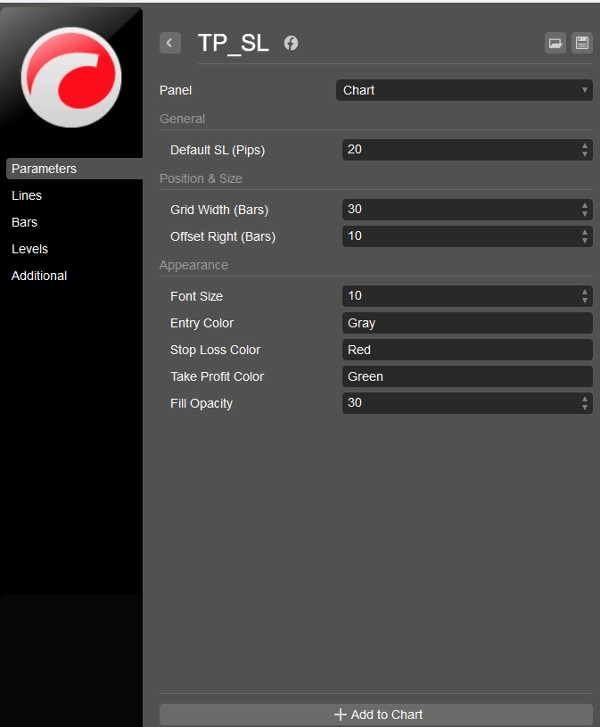
- 网格宽度与偏移: 调整工具的长度(以柱数计)及其与当前价格的距离。
- 视觉效果: 完全控制颜色。为入场、止损和获利线输入任何标准颜色名称(例如 DodgerBlue、Orange、Gray)。
- 不透明度: 调整背景区域的透明度(从 0 到 255),打造时尚的玻璃质感外观。
- 文字大小: 使图表上的标签与您的屏幕分辨率完美匹配。
停止猜测您的目标。直观地规划交易,遵守风险管理,保持图表完美整洁!
该指标对 cTrader 社区完全免费。
摘要
AI summary
TP_SL is a visual risk and reward indicator designed for cTrader that replicates the TradingView-style Long/Short position tool. It enables traders to quickly and intuitively plan trades by drawing and adjusting entry, stop loss, and take profit levels directly on the chart. The tool automatically calculates risk multiples (1R, 2R, 3R, 4R) based on the distance between entry and stop loss, projecting precise take profit zones.
Key features include a smart auto-flip function that switches between long and short positions by dragging the stop loss line above or below the entry line, clean bounded lines that avoid cluttering historical data, and dynamic price tracking that keeps the tool aligned with current price action. Users can draw the setup by holding SHIFT and left-clicking, then adjust levels with drag-and-drop, and delete the drawing with a single key press.
The indicator offers full customization of grid width, offset, colors, opacity, and text size to fit individual chart preferences. It supports visualization on bar-based data and is categorized under pattern indicators with a focus on key levels. TP_SL aims to facilitate precise trade planning and risk management while maintaining clean chart aesthetics.
Key features include a smart auto-flip function that switches between long and short positions by dragging the stop loss line above or below the entry line, clean bounded lines that avoid cluttering historical data, and dynamic price tracking that keeps the tool aligned with current price action. Users can draw the setup by holding SHIFT and left-clicking, then adjust levels with drag-and-drop, and delete the drawing with a single key press.
The indicator offers full customization of grid width, offset, colors, opacity, and text size to fit individual chart preferences. It supports visualization on bar-based data and is categorized under pattern indicators with a focus on key levels. TP_SL aims to facilitate precise trade planning and risk management while maintaining clean chart aesthetics.
指标配置
指标分类
模式
输出类型
可视化
数据要求
仅 K 线
客户评价
0.0
评价:0
客户评价
该产品尚无评价。已经试过了?抢先告诉其他人!
讨论
常见问答
Key Levels
cTrader Store 提供的所有产品,包括交易机器人、指标和插件,均由第三方开发者提供,仅供信息参考和技术访问之用。cTrader Store 并非经纪商,不提供投资建议、个人推荐或任何未来业绩保证。






























价格
32
销售
977
免费安装