"RSI Advanced" logo
Indicator
1 purchases
Version 1.0, Apr 2026
Windows, Mac
5.0
Reviews: 1
"RSI Advanced" uploaded image
24
Sales
623
Free installs

The standard Relative Strength Index (RSI) is one of the most popular indicators in the world, but plotting a single line at the bottom of your chart is an outdated way to trade. It makes it difficult to spot true momentum shifts, acceleration, and market chop.

The RSI Advanced completely reinvents this classic oscillator. By introducing a Signal Line, Volatility Filtering, and Smart Chart Painting, it transforms the RSI into a comprehensive, all-in-one momentum and trend-following dashboard.

Key Features

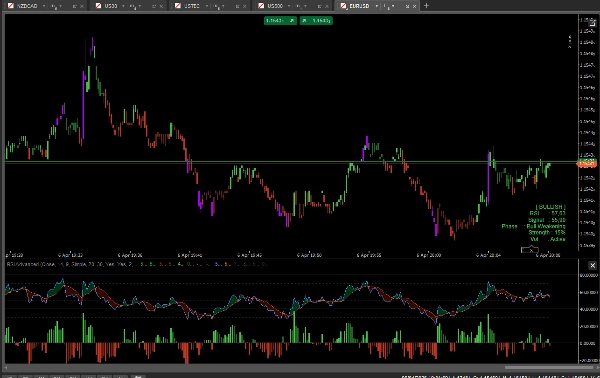
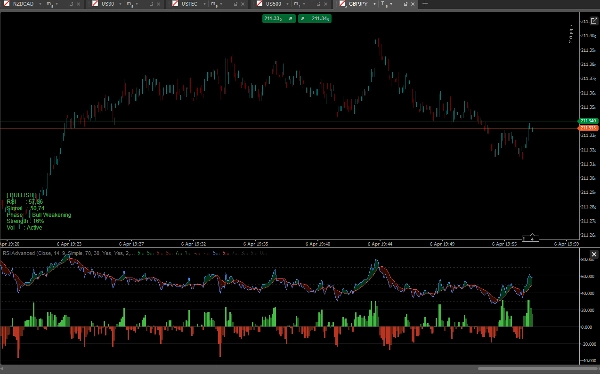
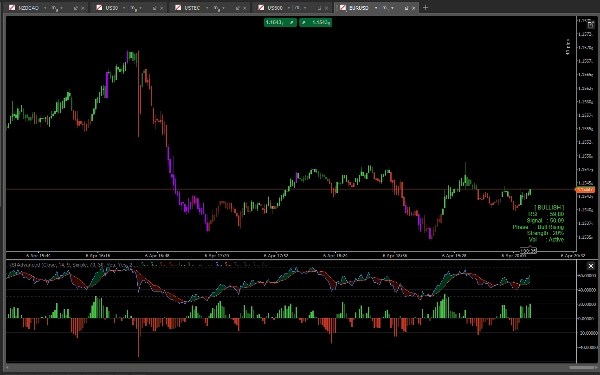
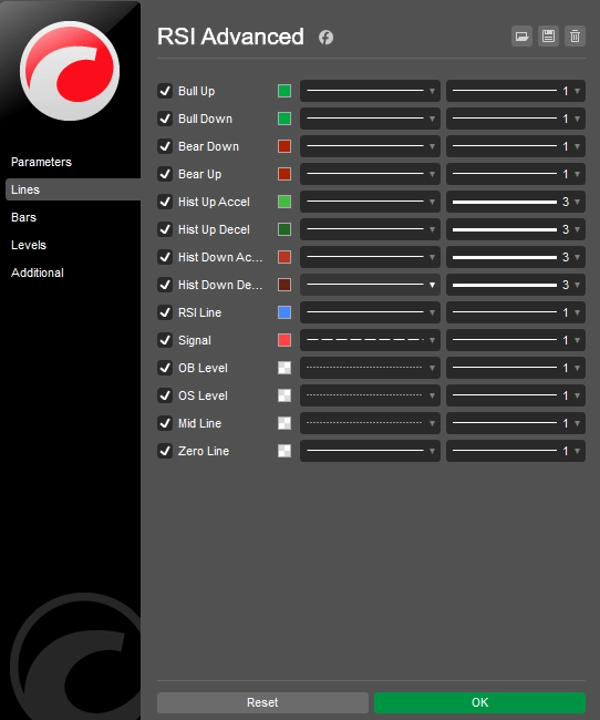
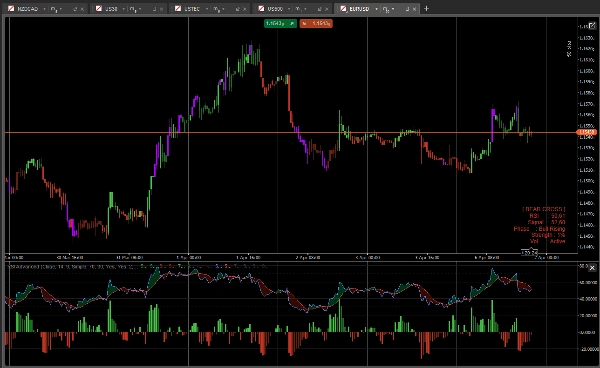
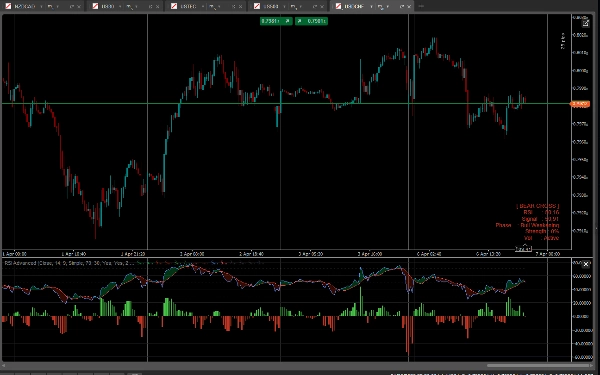
  • RSI & Signal Cloud: We added a Moving Average (Signal Line) to the RSI. The space between the RSI and its Signal Line is filled with a dynamic Cloud. If the cloud is Green, Bulls are driving the momentum. If it’s Red, Bears are in control.
  • Momentum Histogram: A centered histogram tracks the exact distance between the RSI and the Signal Line. With built-in acceleration/deceleration colors (bright vs. dark), you can anticipate crossovers and momentum exhaustion before they happen.
  • Smart Bar Coloring (Paintbars): Your candlesticks will change color based on the underlying RSI momentum:
    • Bright Green/Red: Strong bullish/bearish alignment (RSI > 50 and RSI > Signal).
    • Dark Green/Red: Weak momentum or pullbacks.
    • Purple/Magenta: Extreme Overbought (OB) or Oversold (OS) levels – warning you of potential reversals.
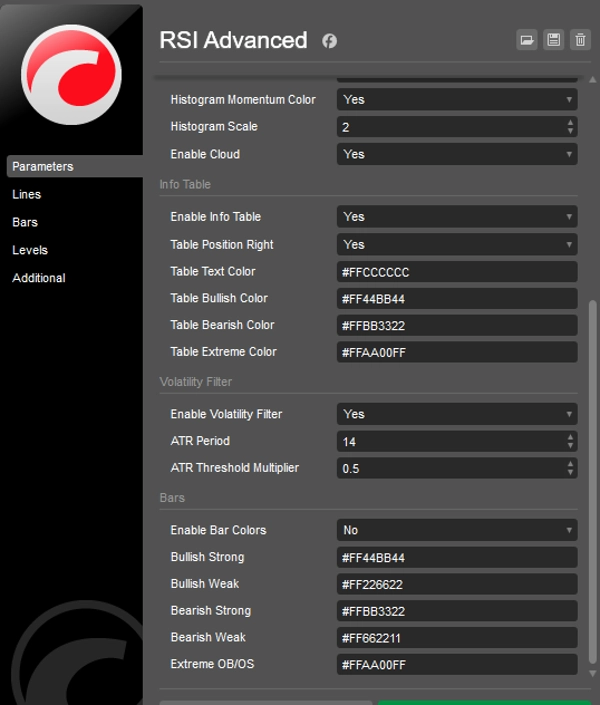
  • Smart Volatility Filter (ATR): Tired of getting chopped up in flat markets? Enable the built-in ATR filter. When volatility drops below your historical average, the candles and histogram turn gray, keeping you out of bad trades.
  • On-Chart Info Dashboard: A sleek data panel displays real-time metrics: exact RSI and Signal values, Momentum Phase, Trend Strength percentage, and Volatility Status.
  • Completely Unlocked: Trade on ANY symbol (Forex, Crypto, Indices, Stocks) and ANY timeframe with zero limitations. Lifetime access.

How to trade with it?

  1. Trend Continuation: Look for pullbacks where the RSI stays above the 50 Mid-Line, but dips slightly into the Signal Line. When the Histogram accelerates (bright green) and candles turn bright green, it's a strong continuation entry.
  2. Reversals: When candles turn Purple (Extreme OB/OS), wait for the RSI to cross back over the Signal Line (Cloud changes color) for a high-probability reversal setup.
  3. Chop Avoidance: If the Volatility Filter turns your bars gray, simply sit on your hands and wait for the market to wake up.
Indicator profile
Indicator category
Volatility
Output type
Filter
Data requirements
Bars only
Supported signals
Cross
Trend strength
Volatility
5.0
Reviews: 1
5
100 %
4
0 %
3
0 %
2
0 %
1
0 %
Customer reviews
April 11, 2026
The first thing that worked was timing feels less random, and a small account test feels safer.
BTCUSD
Forex
Signal
Indices
EURUSD
Commodities
GBPUSD
NZDUSD
RSI
AI
XAUUSD
NAS100
ATR
USDJPY
Products available through cTrader Store, including trading bots, indicators and plugins, are provided by third-party developers and made available for informational and technical access purposes only. cTrader Store is not a broker and does not provide investment advice, personal recommendations or any guarantee of future performance.

More from this author

Indicator
AI
Prop
+8
The EMA Trend Simple is a trend-following tool designed for simplicity and visual clarity.
Indicator
ATR
MACD
+15
MACD Advanced -- It combines the standard MACD logic with a rich set of visual tools
Indicator
AI
Grid
+7
Follow The Trend cBot - INDICATOR - displays two Moving Average Bands for cBot or for your own use
Indicator
AI
SMC
+7
The ultimate tool for Price Action and ICT. High, Low and Mid levels for days, weeks Inc. NY Midnight and Custom Range.
Indicator
ATR
Prop
+13
HCCC MTF (Hurst Cycle Composite Channel), Designed for Semi-Automated Trading, Interactive MTF Dashboard
cBot
Prop Firm Fit
Stop Loss (SL) Manager
+1
HTS Strategy Tester - Advanced Multi-Timeframe Trend & Pullback Trading System H1/m1 & H4/m5 WWS 33/144 Start from 100$
90.1%
ROI
2.92
Profit factor
Indicator
AI
RSI
+7
EMA MTF TREND PRO - Multi-timeframe trend analysis overlay indicator, 6 timeframes - in one table with ADX
Indicator
AI
Prop
+7
EMA Clouds, Multi-Timeframe (MTF) Overlay, Swing High/Low detection, and a smart Dashboard with neutral zone filtering.
Indicator
AI
SMC
+4
Weekly Daily Opening Gaps β€” NWOG & NDOG Indicator Professional-grade opening gap visualization for institutional traders
Indicator
ATR
Channel
+1
Bollinger Bands Advanced Squeeze & Breakout System, Real-Time On-Chart Dashboard, Auto-Squeeze Detector, Dual-Band Cloud
cBot
ATR
EMA
+5
FOLLOW THE TREND XAU EDITION v3.0, Start with $500, AI features BE & TP50%, cbot management simplified
36.2%
ROI
5.09
Profit factor
Indicator
SMC
Prop
+11
Sessions PRO is a professional session visualization indicator - 4 Fully Customizable Sessions

You may also like

Indicator
EMA
SMA
+3
MACD indicator modeled after TradingView, featuring a 4-color momentum histogram, sound/pop-up crossover alerts.
Indicator
Volume
Order Block
+4
Volume Profile with fixed period, custom range and buy/sell pressure.
Indicator
Forex
BTCUSD
+7
πŸš€ TMAX RBA Indicator - The Ultimate Multi-Timeframe Momentum System πŸš€
Indicator
AI
ATR
+26
Liquidity Cluster Order automatically detects and draws accumulation zones & distribution zones
Indicator
Prop
Forex
+4
A precision-crafted indicator that compares current volume to its historical average for the same time of day.
Indicator
Forex
BTCUSD
+11
Visualize trends with Standard Deviation Channel! Display median, and add customizable upper/lower deviation channels.
Indicator
AI
SMC
+9
Identifies market trends (-10 to +10) using HMA with volume confirmation. Includes customizable alerts.
Indicator
AI
ATR
+27
Deep Mood Distribution (DMD) is a segmented volume-profile and sentiment tool that analyzes price action in fixed bar bl
Indicator
BOS
CHOCH
+5
Smart Money Concepts Automate your institutional analysis and make decisions with pinpoint precision..
Indicator
RSI
SMC
+3
High Low Divergence is a clean, overlay indicator that automatically identifies swing highs and swing lows
Indicator
Forex
BTCUSD
+9
Market Sentiment Pro: Predict tops & bottoms using crowd psychology. Contrarian signals with 70-80% accuracy. Early Acce
Indicator
Laguerre RSI: smoother, faster RSI with less noise. Great for spotting reversals and timing entries.
Indicator
ReversalGuard Pro: Domina el Mercado con Zonas de Soporte y Resistencia de Alta PrecisiΓ³n"
Indicator
Bollinger
Jurik Moving Average (Jurik's Moving Average) triple adaptive filter with unique Jurik smoothing and dynamic factor.
Indicator
Prop
Forex
+11
😎Read the description before purchasingπŸ’©
Indicator
SMC
Prop
+17
Unlock the true intent of market participants with the Classic Proportional Cumulative Volume Delta CVD!
Indicator
Market Structure
Support & Resistance
Auto-centers price when it moves beyond threshold. Adjustable zoom. Works on any chart type. Never lose price again.
Indicator
BOS
Fibonacci
+4
Automatically draws major trading sessions, killzones, and SMC daily liquidity targets directly on your cTrader charts.
24
Sales
623
Free installs