

Description
Deep Mood Distribution (DMD) 📊🧠
Overview
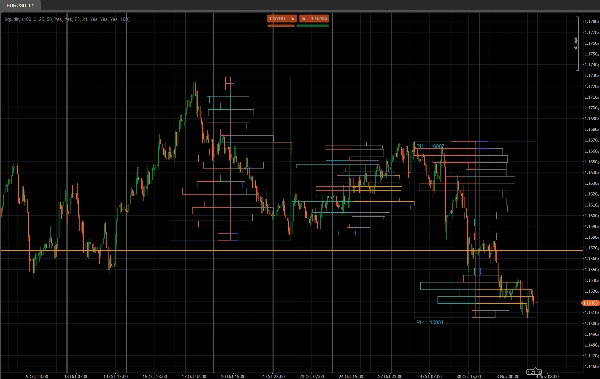
Deep Mood Distribution (DMD) is a segmented volume-profile and sentiment tool that analyzes price action in fixed bar blocks and shows:
- Where trading activity is concentrated ⚖️
- Where liquidity is thin or reactive (potential S&D / liquidity zones) 💧
- Which side is dominating at each price area (buyers vs sellers) 🐂🐻
Instead of a single sliding profile, DMD splits the chart into repeating blocks of X bars and builds a separate liquidity & sentiment map for each block.
This makes it easy to visually compare how volume distribution and market mood change from one segment to the next.
How it works 🧩
For each block of Bars In Profile candles:
- The indicator finds the highest and lowest price of that block.
- The price range is split into
Number of Rowsvertical price bins. - For every candle in the block:
- Tick volume is distributed across each price bin touched by the candle’s range.
- Two volumes are accumulated for each row:
- Total volume at that price row
- Bullish volume (only bars where Close > Open)
- From these, DMD builds:
- Liquidity profile (right side)
- Row length ∝ relative volume vs the block’s maximum row volume
- Color shows high / average / low traded nodes
- Sentiment profile (left side)
- Sentiment per row =
2 × BullishVolume − TotalVolume - Positive = buyer-dominated (bullish mood)
- Negative = seller-dominated (bearish mood)
- Sentiment per row =
- The process is repeated for the last N blocks, so you can compare several segments side by side.
Right Side – Liquidity Profile (Volume) 📊
The right side bars show how much trading activity (volume) occurred at each price level within that block, regardless of who was buying or selling.
- High-volume nodes (HVN) – e.g. orange bars
- A row whose volume is ≥
High Traded Threshold %of the maximum row volume in the block - Represent value areas, heavy trading, consolidation zones.
- A row whose volume is ≥
- Low-volume nodes (LVN) – e.g. blue bars
- A row whose volume is ≤
Low Traded Threshold %of the maximum row volume - Represent thin liquidity zones, possible rejection or fast-move areas.
- A row whose volume is ≤
- Average-volume nodes – e.g. grey bars
- Everything between the high and low thresholds
- “Normal” traded levels, not extreme.
🧠 Length of the bar (right side)
→ Proportional to total traded volume at that price row compared to the block’s max volume.
More volume → longer bar.
Key parameters:
High Traded Threshold %Low Traded Threshold %
Left Side – Sentiment Profile (Market Mood) 🧠📉📈
The left side bars show the sentiment / dominance at each price level: whether buyers or sellers were stronger in that row.
For each row:
Sentiment=2×BullishVolume−TotalVolume\text{Sentiment} = 2 \times \text{BullishVolume} - \text{TotalVolume}Sentiment=2×BullishVolume−TotalVolume
- Bullish bar (buyers in control) – e.g. teal/green bars
- Sentiment > 0
- More volume came from bullish candles (Close > Open) at that price.
- Indicates buy-side dominance in that price row.
- Bearish bar (sellers in control) – e.g. red bars
- Sentiment < 0
- More volume came from bearish candles (Close < Open).
- Indicates sell-side dominance.
🧠 Length of the bar (left side)
→ Proportional to the absolute value of sentiment (|Sentiment|) relative to the strongest row in the block.
Stronger dominance (big imbalance between buyers and sellers) → longer bar.
Key parameter:
Show Sentiment Profile(on/off)
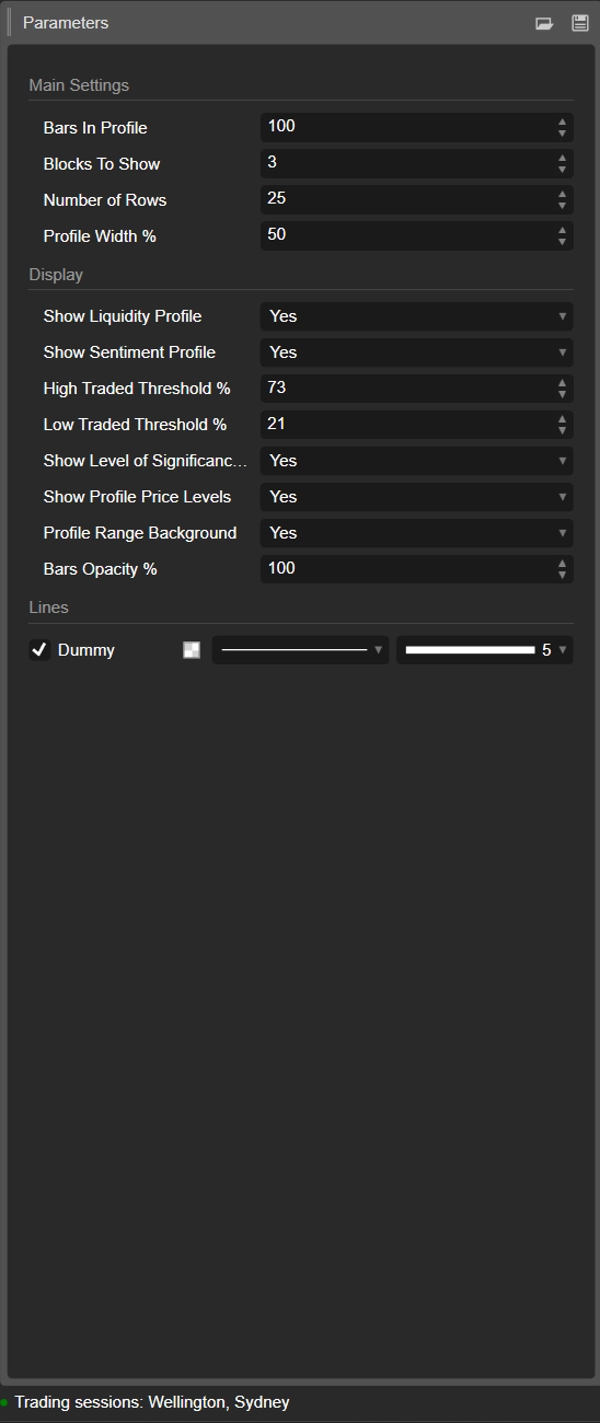
Parameter Details ⚙️
1. Bars In Profile
Group: Main Settings
Number of candles contained in each block.
- Example:
Bars In Profile = 100 - Block 0 → last 100 bars
- Block 1 → previous 100 bars
- Block 2 → previous 100, and so on.
Use it to match blocks to:
- approximate sessions,
- your typical swing / intraday range,
- or any custom window you want to analyze.
Smaller value = more reactive, more granular.
Larger value = smoother, more “macro” structure.
2. Blocks To Show
Group: Main Settings
How many consecutive blocks will be drawn on the chart.
1→ only the most recent block2–3→ very practical for comparison without clutter- Higher values → more history, but more on-chart objects
Older blocks beyond this value are automatically cleaned up to maintain stability.
3. Number of Rows
Group: Main Settings
Vertical resolution of each block’s profile.
The block’s price range is divided into this many rows (price levels).
- Higher value → more detail, thinner rows, more rectangles
- Lower value → smoother structure, easier to read
Typical ranges:
15–25for normal intraday use30–40+only if you want very fine resolution and your platform is strong enough
4. Profile Width %
Group: Main Settings
Controls how far the profile extends horizontally from the block’s center, as a percentage of the block’s width.
- Affects both liquidity (right side) and sentiment (left side).
- Higher % → profiles extend further into the surrounding bars
- Lower % → compact profile close to the block center
Good starting values: 35–50%.
5. Show Liquidity Profile
Group: Display
Turns the volume distribution (liquidity profile) on or off (right side of each block).
- On ✅
- Each row’s length reflects relative traded volume at that price level.
- Color encodes high / average / low traded nodes.
- Off ❌
- Only sentiment (if enabled) is shown, no volume bars on the right.
6. Show Sentiment Profile
Group: Display
Turns the sentiment profile on or off (left side of each block).
- On ✅
- Rows are colored:
- Bullish (buyers dominant) – e.g. aqua/green
- Bearish (sellers dominant) – e.g. red
- Row length reflects strength of dominance.
- Off ❌
- Only pure liquidity/volume distribution is shown.
Use this if you want to see not just where volume traded, but who was more active at those levels.
7. High Traded Threshold %
Group: Display
Defines the cutoff for high-volume nodes (HVNs) inside each block.
- Expressed as % of the block’s maximum row volume.
- Example: Max row volume = 10,000; threshold = 70% → rows ≥ 7,000 count as HVNs.
HVNs often mark:
- value areas,
- consolidation zones,
- areas of strong positioning / fair value.
8. Low Traded Threshold %
Group: Display
Defines the cutoff for low-volume nodes (LVNs) relative to the block’s maximum volume.
- Rows with volume below this percentage are treated as low activity zones.
- These can act as:
- thin liquidity pockets,
- potential rejection levels,
- or areas where price tends to move quickly through.
Typical use: 15–30%.
9. Show Level of Significance (POC)
Group: Display
Shows or hides the Point of Control (POC) for the most recent block.
- POC = price row with highest traded volume in that block.
- Displayed as a horizontal line at that price. 🎯
Useful as:
- reference for mean-reversion,
- intraday “fair price” anchor,
- or key level for trade management.
10. Show Profile Price Levels
Group: Display
Displays text labels for:
- Profile High (PH) – highest price reached in the block
- Profile Low (PL) – lowest price reached in the block
Labels are shown for the most recent block and include the exact price values.
Great for:
- quickly reading the current range,
- setting stops/targets around PH/PL,
- context for breakouts or rotations.
11. Profile Range Background
Group: Display
Draws a semi-transparent background rectangle covering each block’s:
- time range (start to end bar)
- price range (low to high)
This visually separates blocks and makes each range stand out.
Disable it if you prefer a cleaner, minimal visual.
12. Bars Opacity %
Group: Display
Controls how solid or subtle the rectangles are (both liquidity and sentiment bars).
- 20–40% → very light, background-style
- 50–70% → balanced visibility, candles still easy to see
- 80–100% → strong, almost fully opaque blocks
Internally this value is converted into an alpha channel (0–255) for the bar colors.
Suggested starting template ⭐
For indices / futures intraday (M5–M15):
- Bars In Profile: 80–120
- Blocks To Show: 2–3
- Number of Rows: ~20
- Profile Width %: 35–45
- Show Liquidity Profile: true
- Show Sentiment Profile: true
- Bars Opacity %: 50–65
Summary
Key features include:
- Liquidity Profile (right side): Displays trading volume concentration at each price level within a block, highlighting high-volume nodes (HVNs), low-volume nodes (LVNs), and average-volume nodes. Bar length corresponds to relative traded volume, and colors indicate volume intensity.
- Sentiment Profile (left side): Shows buyer vs. seller dominance per price level, calculated as twice the bullish volume minus total volume. Positive values indicate buy-side control; negative values indicate sell-side control. Bar length reflects the strength of dominance, with color coding for bullish (green/teal) and bearish (red) sentiment.
- Configurable parameters: number of bars per profile block, number of blocks displayed, vertical resolution (rows), profile width, opacity, and thresholds for defining HVNs and LVNs.
- Additional display options: Point of Control (POC) line for highest volume price in the latest block, profile high/low price labels, and background shading for block ranges.
DMD supports analysis across various markets including indices, commodities, forex, and cryptocurrencies, facilitating identification of trading activity concentration, liquidity zones, and market sentiment shifts within customizable timeframes.
Customer reviews
5 | 0 % | |
4 | 100 % | |
3 | 0 % | |
2 | 0 % | |
1 | 0 % |


