„Liquidity Pressure Index“-Logo
Liquidity Pressure Index
4.0
Bewertungen: 1
In „Liquidity Pressure Index“ hochgeladenes Bild
Seit 13/09/2025
20
Verkäufe
3.9K
Kostenlose Installationen

Liquidity Pressure Index is a professional‑grade tool designed to give traders a deeper look into the hidden dynamics of market liquidity. Unlike traditional oscillators that only react to price, Liquidity Pressure Index blends tick volume, volatility compression, and directional flow into a single, easy‑to‑read line. This makes it a powerful companion for traders who want to understand whether buying or selling pressure is truly dominating behind the candles.


At its core, ALB calculates the balance between accumulated buy liquidity and accumulated sell liquidity, normalizing the result against rolling tick volume. The output is centered around the neutral level of 50. Values above 50 indicate stronger buying liquidity, while values below 50 highlight stronger selling liquidity.


This simple visual cue allows traders to instantly gauge the underlying order flow without needing to interpret multiple indicators at once.


How to Read the Indicator

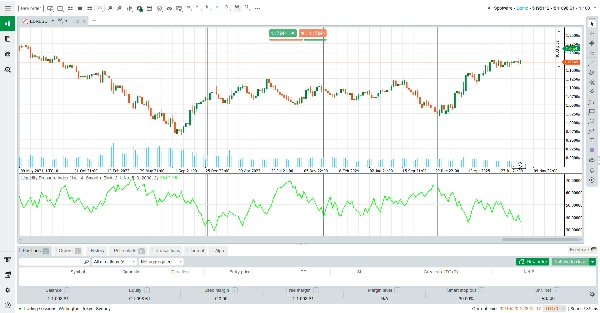
Line above 50: Market shows stronger buy‑side liquidity. This often supports bullish continuation or signals hidden demand absorbing sell orders.


Line below 50 : Market shows stronger sell‑side liquidity. This often supports bearish continuation or signals hidden supply absorbing buy orders.


Flat or near 50: Liquidity is balanced, suggesting indecision or consolidation.


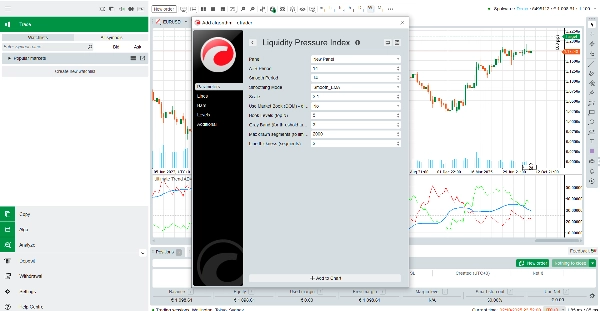
Smoothing options: Traders can choose between EMA or KAMA smoothing to reduce noise and focus on the dominant liquidity trend.


How It Works

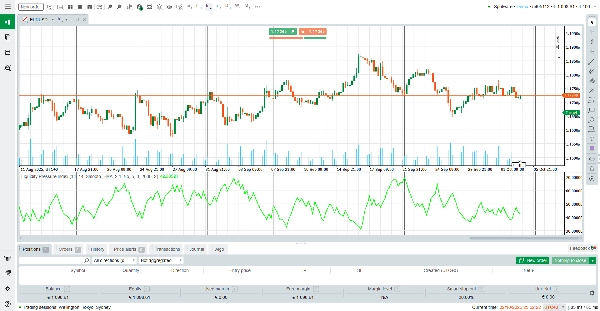
The indicator first measures true range volatility (ATR) and compares it with the actual candle range to estimate compression. It then combines this with tick volume to separate pending liquidity (orders waiting in the book) from executed liquidity (orders already filled). Depending on candle direction, the algorithm allocates hidden buy or sell absorption. Finally, the result is normalized against a rolling EMA of tick volume, scaled, and smoothed for clarity.


The outcome is a dynamic liquidity index that adapts to market conditions and reveals the tug‑of‑war between buyers and sellers in real time.


Key Features

Liquidity‑Focused Insight: Goes beyond price to reveal hidden buy/sell pressure.


Adaptive Smoothing: Choose between EMA or KAMA for noise reduction.


Customizable Parameters: Control ATR period, smoothing length, scale, and line thickness.


Optimized Performance: Lightweight design with segment limits to ensure smooth charting.


Why Use Liquidity Pressure Index?


In fast‑moving markets, price alone can be misleading. The Advanced Liquidity Balance equips traders with a deeper perspective, showing whether the market is truly supported by liquidity or if moves are running on weak participation. Whether you are a scalper looking for short‑term imbalances or a swing trader confirming trend strength, Liquidity Pressure Index provides a professional‑grade liquidity lens—and best of all, it’s completely free.


Download it today and add a new dimension of clarity to your trading decisions.

Indicator profile
4.0
Bewertungen: 1
5
0 %
4
100 %
3
0 %
2
0 %
1
0 %
Kundenbewertungen
October 20, 2025
See where the pressure’s real 💥 - Liquidity Pressure Index reveals hidden forces driving price moves. A must-have for smart volume traders!
BTCUSD
Forex
Signal
Breakout
RSI
Indices
EURUSD
Commodities
MACD
Scalping
ATR
Crypto
AI
Stocks
XAUUSD
Products available through cTrader Store, including trading bots, indicators and plugins, are provided by third-party developers and made available for informational and technical access purposes only. cTrader Store is not a broker and does not provide investment advice, personal recommendations or any guarantee of future performance.

Mehr von diesem Autor

SuperTrend X cBot is a fully automated trading robot for cTrader built entirely on the power of the SuperTrend indicator
Signal Strike is a professional trading indicator delivers clear, high‑confidence entry signals directly on your chart
Stop Loss Pro – Precision Risk Management for Every Trader
Gold Pulse Pro – An automated trading system for gold (XAUUSD) precisely engineered and powered by advanced algorithms
EMA 21 13 8 Scalper is a fully automated trading system that captures intraday momentum with clarity and discipline
Supertrend RSI ADX is a trading system built for traders who demand precision, control, and steady performance.
indicator showing the Daily Open Line and instantly shading bullish and bearish zones.
Perfect Entry Price designed to help traders identify the most accurate and reliable price levels for market entries
Download Ultimate Trend ADX today and experience a smarter way to track market trends completely free on ctrader
Final Moving Average is an adaptive system designed to keep traders aligned with the true direction of the market
Measure Market Strength at a Glance – Instantly
Gold Predict AI – Advanced Predictive Trading for XAUUSD (M15)

Das könnte Sie auch noch interessieren

PinBarCandlestickPattern Indicator
Auto-detect supply & demand zones, remove broken levels, and trade smarter with real-time alerts. Precision made simple.
Integrated Market Analysis: Volume Profile + Statistical Projection 🎯
MultiFrameCandles para cTrader: La Herramienta Definitiva para Dominar Cualquier Marco de Tiempo
Displays live spread and estimated trading cost directly on chart to help assess conditions before entering a trade.
Professional Fair Value Gaps with multitimeframe spot on
Precision ICT indicator detecting NWOG, NDOG & EHPDA for high-probability institutional trading setups.
Advanced Volatility Suite - Institutional-Grade Volatility Forecasting
Unlock Stochastic RSI PRO in cTrader! Overlay RSI, highlight zones, and identify divergences with customizable settings.
Trend-coloring Donchian cloud that highlights volatility squeezes and breakouts.
Session boxes & highs/lows for Asian, London and NY to trade liquidity, breakouts and intraday structure.
Are essentially short intervals during which the algorithm seeks liquidity or adjusts price.....
Enhance your trading with customizable alerts and dynamic visual tools for trendlines, Fibonacci levels, and more.
A simple tool to control market sessions. For Tokyo,London, New York
🚀 True Trend HTF PRO Trade with the dominant trend. Avoid low-quality setups. Stop second-guessing.
Designed to plot a future prediction channel based on Fibonacci retracement levels 📊
The profit and loss of your current trades are always displayed on the chart.
Volume Profile Price Period and Live VAH,VAL,POC,
Seit 13/09/2025
20
Verkäufe
3.9K
Kostenlose Installationen