"PriceLevels" logo
PriceLevels
"PriceLevels" uploaded image
Since 05/01/2025
11
Sales

Key Features:

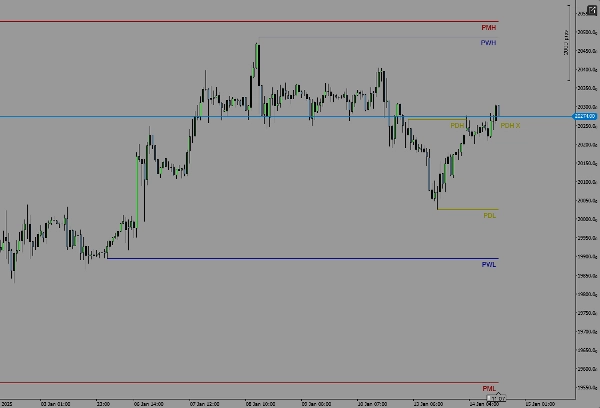
  • Displays yesterday's high and low levels.
  • Displays last week's high and low levels.
  • Displays last month's high and low levels.
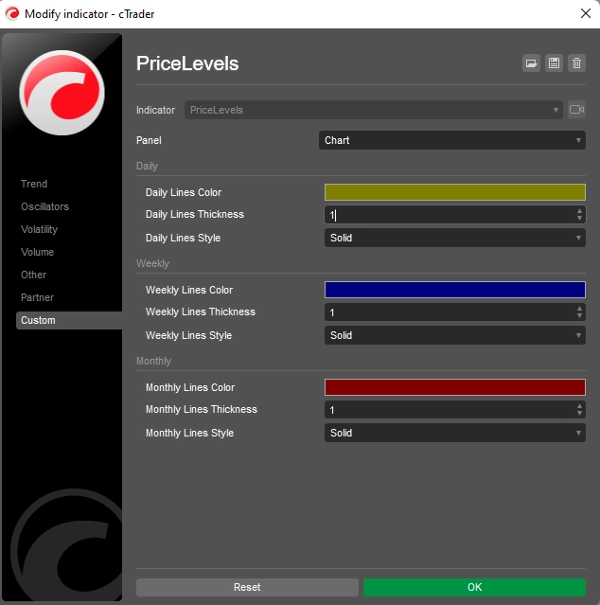
  • Customizable colors and line styles for each level.

How It Works:

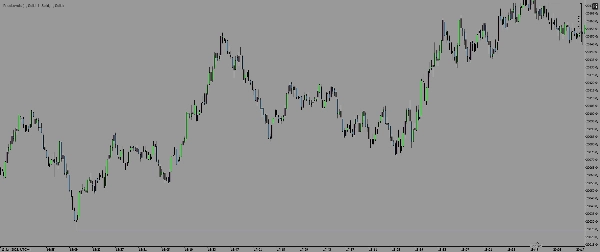
The indicator automatically calculates the highest and lowest prices for the previous day, week, and month based on your chart's timeframe. These levels are then plotted as horizontal lines on your chart, providing a clear visual reference for historical price action.

Compatibility:

  • Designed for cTrader platform only.
  • Works on all timeframes and instruments.


If you have any questions, feedback, or suggestions for improvement, feel free to reach out! Your input is highly valued and will help make this indicator even better.

Happy trading!

Indicator profile
0.0
Reviews: 0
Customer reviews
No reviews for this product yet. Already tried it? Be the first to tell others!
Products available through cTrader Store, including trading bots, indicators and plugins, are provided by third-party developers and made available for informational and technical access purposes only. cTrader Store is not a broker and does not provide investment advice, personal recommendations or any guarantee of future performance.

More from this author

Vision - Advanced Session Indicator
FVG Multi Time Frame Indicator
It draws Pivot Levels on the chart.
Supertrend - Multi-Timeframe Indicator
Bingo - Professional Position Manager
SCOB - Single Candle Order Block Indicator

You may also like

Simple and efficient Indicator Designed to be profitable .With alarms for trend changes and support - resistance
Open Range Breakout by SLA is a fully customizable multi-session indicator designed for structured intraday traders.
Where price swings, volume speaks
Detects CHoCH breakouts, draws interest zones & auto Fibo. Built for Smart Money & Price Action Engulfing confirmation
implifies market analysis by automatically identifying bullish 🚀 or bearish 🐻 phases and marking key levels where ....
Fixed Range Volume Profile (FRVP) : analyzes price volume within a custom rectangle to find POC, VAH, and VAL.
Channel Trading is a volatility-based indicator using envelope theory to spot price breakouts and trade signals.
Visualize global Forex trading sessions with clear time blocks for better timing and strategy planning.
Power of Three indicator reveals accumulation, manipulation, and distribution phases for precise intraday timing.
Universal Moving Average indicator with extended features
Market Cipher B
Indicator for my Bot
💹 Define a price channel 📈 and determine trend direction (bullish 🟢 or bearish 🔴).
The Fair Value Gap (FVG) Indicator identifies inefficiencies in price action where an imbalance occurs due to aggressive
Fair Value Gap indicator with signals that detects and draws true 3-candle FVG zones, keeps all valid gaps visible....
Laguerre RSI is based on John EHLERS' Laguerre Filter to avoid the noise of RSI.
🎯Identify zones of HIGH INSTITUTIONAL INTEREST: Where there is MORE VOLUME in the breaks, there is GREATER PARTICIPAT..
The CRT indicator helps ICT traders identify candlestick patterns, enhancing analysis of higher timeframe on lower
Since 05/01/2025
11
Sales