
Candle Volume Profile Demo
Indicator
460 downloads
Version 1.0, Nov 2025
Windows, Mac
4.0
Reviews: 1
Description
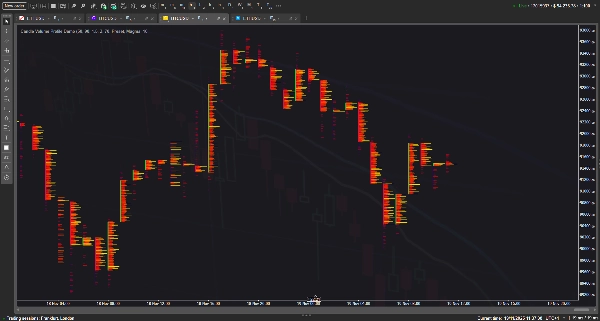
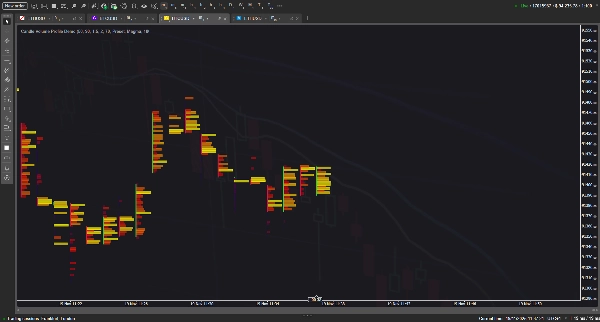
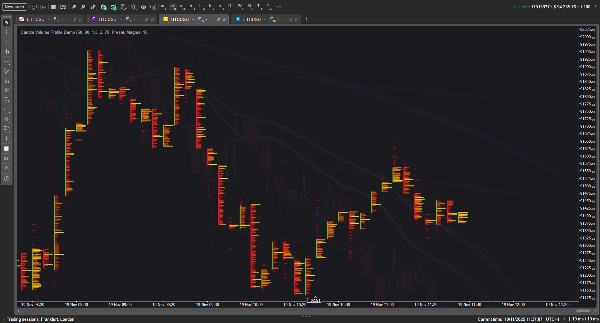
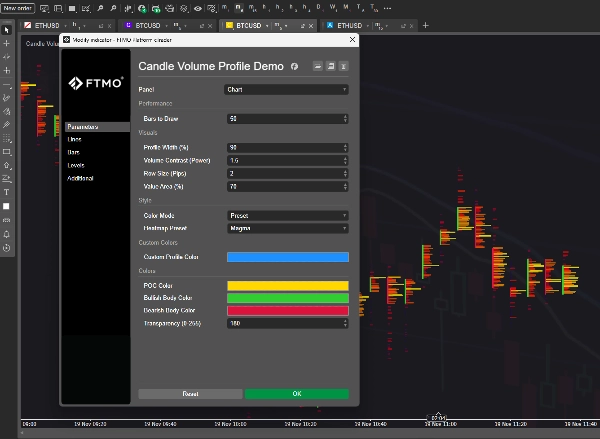
This indicator visualizes the Volume Profile for individual bars, transforming standard candlesticks into a detailed 'footprint' style chart with customizable heatmaps, Point of Control (POC) lines, and Value Area blocks to highlight volume distribution per price level. It aims to emulate professional order flow tools by using heuristic volume distribution to render market activity directly on the chart.
Theoretically, this concept should work seamlessly to provide deep market insights; however, in practice, due to the immense number of graphical objects required for rendering, the more features and history depth you demand from this indicator, the more it tends to lag and cause terminal instability. :(
Summary
AI summary
Candle Volume Profile Demo is an indicator designed for cryptocurrency markets, specifically visualizing volume distribution within individual candlestick bars. It transforms standard candlesticks into detailed footprint-style charts by applying heuristic volume profiling techniques. Key features include customizable heatmaps, Point of Control (POC) lines, and Value Area blocks, which highlight volume concentration at specific price levels. This approach aims to replicate professional order flow analysis by rendering market activity directly on the price chart, providing granular insights into volume dynamics per bar. The indicator supports BTCUSD and other crypto symbols, integrating concepts such as Fair Value Gap (FVG), ZigZag patterns, ATR, and VWAP for enhanced volume and volatility context. Users can adjust visualization parameters to explore volume profiles over different historical depths, though extensive feature use may impact performance due to graphical complexity. This tool is intended for traders seeking detailed volume-based market structure analysis within crypto trading environments.
Indicator profile
Customer reviews
4.0
Reviews: 1
5 | 0 % | |
4 | 100 % | |
3 | 0 % | |
2 | 0 % | |
1 | 0 % |
Customer reviews
November 24, 2025
Candle Volume Profile Demo gives you a clean visual of volume distribution inside candles/ranges - a smart add-on for liquidity-aware traders. The visualization is sharp and performance solid, but as a demo version it lacks full features (history logs, advanced filters). Best when paired with structure and confirmation tools. A good starting point, ready to level up.
Discussion
FAQ
BTCUSD
Signal
ZigZag
Fair Value Gap
Crypto
ATR
VWAP
Products available through cTrader Store, including trading bots, indicators and plugins, are provided by third-party developers and made available for informational and technical access purposes only. cTrader Store is not a broker and does not provide investment advice, personal recommendations or any guarantee of future performance.


!["[Hamster-Coder] Bollinger Bands" logo](https://cdn.ctrader.com/image/webp/21d8e5d6-fb11-4bac-b9ee-cd05c2b76804_30327)


Price
Since 26/05/2025
385.09M
Traded volume
60.66K
Pips won
14
Sales
1.4K
Free installs