present
Zarejestruj się i otrzymaj 50 $ zniżki na pierwszy zakup
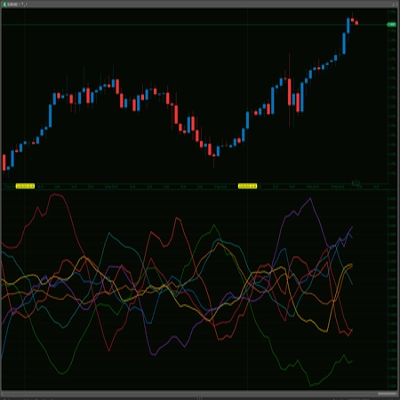
Trading product for JPYX w HMA Wskaźnik Forex Indices, image 1
JPYX w HMA
Wskaźnik
52 pobrania
Wersja 1.0, Apr 2025
Windows, Mac
Trading product for JPYX w HMA Wskaźnik Forex Indices, image 2
Trading product for JPYX w HMA Wskaźnik Forex Indices, image 3
58
Sprzedaż
11.89K
Bezpłatne instalacje

Opis

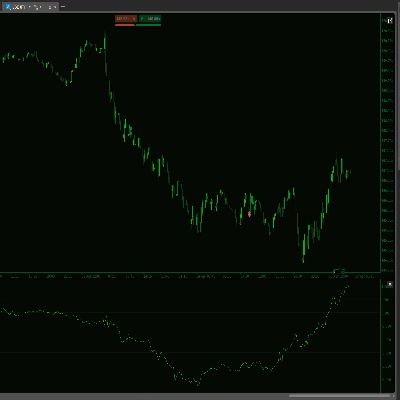
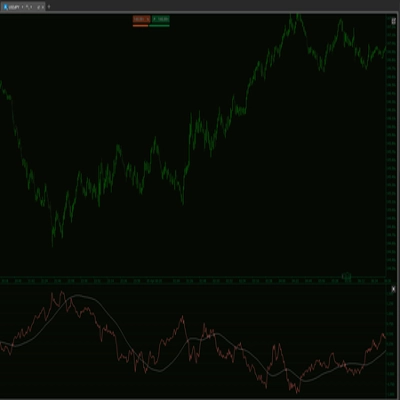
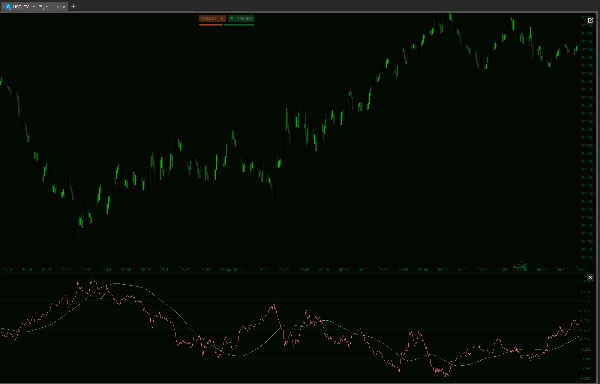
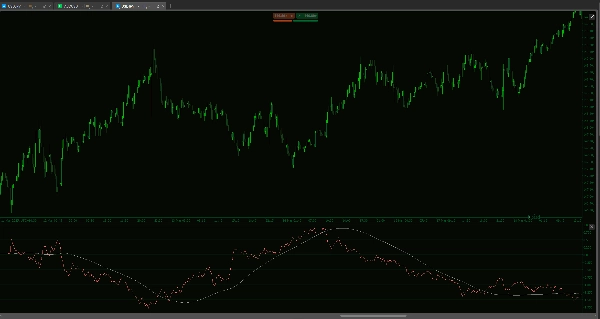
Przedstawiamy Historyczny Wskaźnik Indeksu JXY Jena – ostateczne narzędzie do oceny siły japońskiego jena względem głównych walut. Ten zaawansowany wskaźnik cTrader łączy dane z sześciu kluczowych par jena (EURJPY, GBPJPY, AUDJPY, NZDJPY, CADJPY, USDJPY) z możliwością dostosowania wag, aby dostarczyć kompleksowy, aktualny obraz wydajności jena.

Kluczowe cechy:

  • Kompleksowa mieszanka walut:
    Integruje sześć kluczowych par jena, z których każda jest ważona tak, aby odzwierciedlać ich wpływ na rynek. Odwrócony mechanizm zmiany procentowej zapewnia, że gdy para umacnia się względem jena, jej wkład dokładnie sygnalizuje ogólną wydajność jena.
  • Wielowarstwowa analiza trendów:
    Skorzystaj z zestawu narzędzi wygładzających, w tym opcjonalnej SMA oraz podwójnych średnich kroczących Hull (krótkoterminowej i długoterminowej), które filtrują szumy i podkreślają prawdziwe trendy rynkowe, dając Ci jasność do podejmowania pewnych decyzji handlowych.
  • Dostosowywalny i solidny:
    Dostosuj parametry takie jak liczba świec do analizy wstecznej, wagi oraz okresy średnich kroczących, aby dopasować wskaźnik do swojego unikalnego stylu handlu. Opcjonalne resetowanie sesji utrzymuje Twoją analizę świeżą i zgodną z początkiem nowych sesji handlowych.
  • Praktyczne spostrzeżenia:
    Niezależnie od tego, czy śledzisz subtelne zmiany, czy główne trendy, Historyczny Wskaźnik JXY dostarcza praktycznych spostrzeżeń, które pozwolą Ci wykorzystać momentum jena.

Podnieś swoją strategię handlową dzięki temu nowoczesnemu narzędziu technicznemu. Wykorzystaj moc Historycznego Wskaźnika Indeksu JXY Jena i przekształć złożone dane rynkowe w jasne, strategiczne możliwości handlowe.


--------------------------

Zapraszam do zapoznania się z moimi innymi wskaźnikami!

https://ctrader.com/products/1181

https://ctrader.com/products/1182

https://ctrader.com/products/1180

https://ctrader.com/products/1015

https://ctrader.com/products/555

https://ctrader.com/products/553

https://ctrader.com/products/554

https://ctrader.com/products/552

https://ctrader.com/products/557

https://ctrader.com/products/845

https://ctrader.com/products/848

https://ctrader.com/products/847

https://ctrader.com/products/846

https://ctrader.com/products/551

https://ctrader.com/products/574

https://ctrader.com/products/573

https://ctrader.com/products/556

https://ctrader.com/products/558

https://ctrader.com/products/559

https://ctrader.com/products/560


Podsumowanie

Podsumowanie AI
The Historical JXY Yen Index Indicator is a cTrader tool designed to measure the strength of the Japanese Yen against major currencies. It synthesizes data from six key Yen pairs—EURJPY, GBPJPY, AUDJPY, NZDJPY, CADJPY, and USDJPY—using customizable weightings to provide a comprehensive, real-time assessment of Yen performance. The indicator employs an inverted percentage change mechanism, ensuring that as a pair strengthens against the Yen, its impact accurately reflects the Yen’s overall strength.

Key functionalities include multi-layered trend analysis through smoothing tools such as an optional Simple Moving Average (SMA) and dual Hull Moving Averages (short and long term), which help filter market noise and highlight true trends. Users can customize parameters like candle lookback count, pair weightings, and moving average periods to fit their trading style. Optional session resets allow alignment with new trading sessions for up-to-date analysis.

This indicator supports actionable insights for tracking both subtle shifts and major trends in the Yen’s momentum, aiding traders in making informed decisions based on a synthesized view of multiple currency pairs.
Profil wskaźnika

Opinie klientów

0.0
Opinie: 0
Opinie klientów
Ten produkt nie ma jeszcze opinii. Wypróbowałeś(-aś) go już? Bądź pierwszy(-a) i powiedz o tym innym!

Dyskusja

Częste pytania

Forex
Indices
USDJPY
Produkty dostępne za pośrednictwem cTrader Store, w tym boty handlowe, wskaźniki i wtyczki, dostarczane są przez deweloperów zewnętrznych i udostępniane wyłącznie w celach informacyjnych oraz w celu zapewnienia dostępu technicznego. cTrader Store nie jest brokerem i nie zapewnia doradztwa inwestycyjnego, nie udziela spersonalizowanych rekomendacji ani nie gwarantuje przyszłych wyników.

Więcej od tego autora

Wskaźnik
Forex
Crypto
+3
Track major trading sessions (Tokyo, London, New York) with customizable colors and visual sessions on your chart.
Wskaźnik
Auto-detect supply & demand zones, remove broken levels, and trade smarter with real-time alerts. Precision made simple.
Wskaźnik
Forex
Market Session V2: Full Control. colors, history, session/text toggles, font size. Elevate your strategy!
Wskaźnik
Forex
Version 3: Full control of session display including start and end times of all 3 sessions!
Wskaźnik
Supply and demand zones. They're important. Here's a free version to get you started!
Wskaźnik
The Multi-Timeframe Candle Indicator displays candles from multiple timeframes in one window, enhancing market analysis!
Wskaźnik
VWAP
VWAP Set to London Open
Wskaźnik
The long awaited new and improved Supply Demand Premium V2 indicator. Unlock greater trading opportunities now!
Wskaźnik
SMC
Prop
+13
Smart Money Suite (Lite): BOS, CHoCH, Swing structure, PDH/PDL & session killzones. Essential SMC tools, zero clutter.
Wskaźnik
Forex
NZDUSD
+2
RCS: 8 majors! AUD,USD,EUR,JPY,GBP,CAD,CHF,NZD. Find how strong each currency is relatively and trade smarter!
Wskaźnik
Forex
EURUSD
+3
US Dollar Index
Wskaźnik
BOS
MSS
+2
Stay ahead with a real-time countdown to candle closes on all key timeframes: 5m, 15m, 30m, 1H, 4H, and Daily.

Możesz także polubić

Wskaźnik
Laguerre RSI: smoother, faster RSI with less noise. Great for spotting reversals and timing entries.
Wskaźnik
Order Block
Fair Value Gap
+1
This indicator contains most of the ICT strategies that you need. You can turn on/off each one to be shown.
Wskaźnik
Volume
Imbalance
+1
Volume profile indicator that auto-detects the latest trendline. Shows POC, Value Area (VAH/VAL), and High Volume Nodes
Wskaźnik
Signal
USDJPY
See USD demand in one line—Composite OBV fuses six major FX pairs into a clear momentum gauge.
Wskaźnik
SMC
Forex
+5
The only cTrader FVG indicator with Breakaway Gap detection, mitigation tracking, and full multi-asset compatibility.
Wskaźnik
MACD
Crypto
A simple tool to control market sessions. fixed the display on the weekend.
Wskaźnik
This indicator is designed to display customizable moving averages (MAs) on a chart.
Wskaźnik
BOS
MSS
+5
WinSMC is an overlay SMC indicator for cTrader. It helps you visually identify!
Wskaźnik
AI
SMC
+9
Identifies market trends (-10 to +10) using HMA with volume confirmation. Includes customizable alerts.
Wskaźnik
EMA
Channel
+5
⚡ Institutional Nasdaq (NQ/US100) Trend Engine: Adaptive M1–D1 EMA alignment, chop slope filters, zero-clutter symbols &
Wskaźnik
Volume
Key Levels
+4
Margin Zones its CME-based support/resistance levels from price extremes, helps traders spot entries and exits NKZ zones
Wskaźnik
Prop
Forex
+7
The Parabolic SAR, or "Stop and Reverse," is a dynamic technical analysis tool.
Wskaźnik
Forex
BTCUSD
+9
Market Sentiment Pro: Predict tops & bottoms using crowd psychology. Contrarian signals with 70-80% accuracy. Early Acce
Wskaźnik
Forex
The cTrader Market Sessions Alerts Indicator marks global sessions, highlights key levels, and sends real-time alerts.
Wskaźnik
EMA
VWAP
+2
ORB Range Indicator maps the opening range and gives a practical session-breakout workflow with clear labels.
Wskaźnik
Liquidity Sweep
A complete system for NASDAQ The tool that separates traders who "guess" from traders who operate like a professional.
Wskaźnik
RSI
VegaXLR's cTrader StochRSI identifies overbought/oversold RSI levels for precise trade entries.
Wskaźnik
ATR
EMA
+5
The indicator displays potential reversal zones (support/resistance) on the chart based on the average range (High–Low)

Cena

58
Sprzedaż
11.89K
Bezpłatne instalacje