説明
アップグレード版利用可能 こちら
ネイティブの時間枠オーバーレイ以上のものをお探しですか?アップグレードされた カスタム時間枠 インジケーターは、強力な追加機能でこのコンセプトを拡張します:
- 非標準期間(5時間、7時間、9時間〜23時間、25分、35分、50分、55分、4日、2週間、3週間、複数月、複数年)
- OHLCライン 完了または形成中のバーのためのバーオフセット制御付き
- 7つのフィボナッチレベル(11.4%〜88.6%)均衡ゾーンのハイライト付き
- 移動平均線 カスタム時間枠構造上で直接計算(9種類のMA、8つの価格ソース)
- トグルボタン 迅速な機能管理のためのもの。
標準チャート間隔の間の期間で完全なテクニカル分析オーバーレイが必要な場合は、アップグレード版 をご覧ください。
__________________________________________________________________________________________
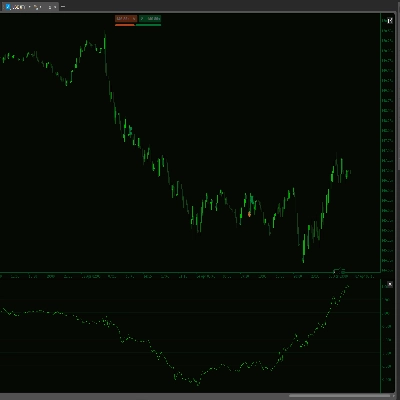
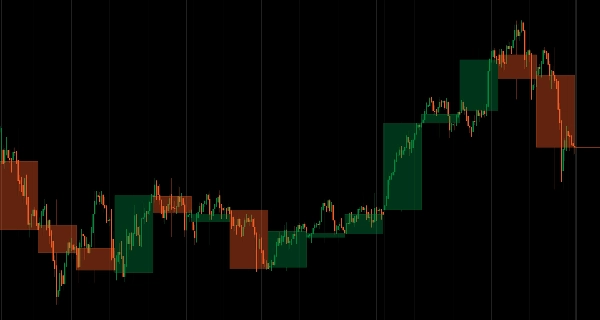
時間枠を切り替えずに任意のチャートにリアルタイムのHTFローソク足をオーバーレイ。
高時間枠のローソク足構造(実体とヒゲ)を低時間枠チャート上に直接表示し、期間の進行に伴いライブで更新します。
柔軟な時間枠選択(日足をH1に、週足をH4に、月足を日足に)、色分けされた強気/弱気バイアス(緑/赤)、カスタマイズ可能なラインスタイルと透明度、軽量パフォーマンスにより、チャート切り替えなしで複数時間枠の構造を監視するトレーダーに継続的なHTFコンテキストを提供します。
特徴
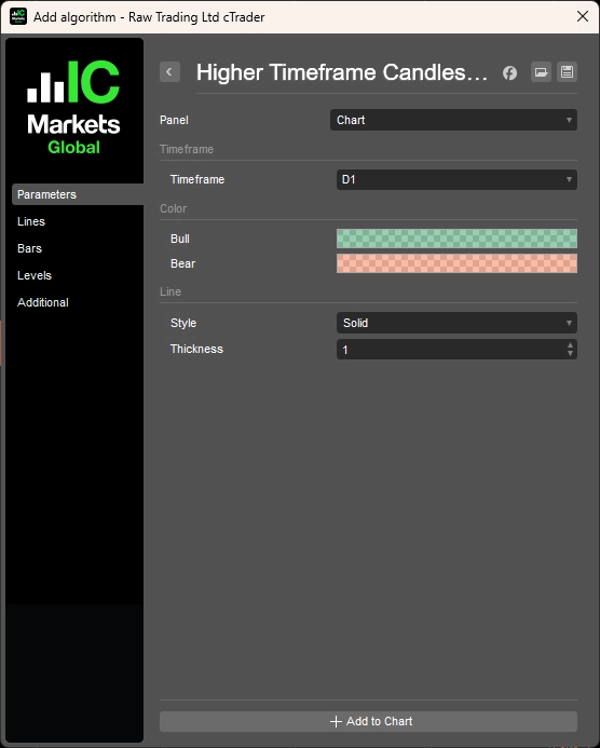
柔軟な時間枠選択
- 任意のHTF:H1上の日足、H4上の週足、日足上の月足—お好みで
- リアルタイム更新:期間の進行に伴うHTFローソク足の再描画
- 常に表示:高時間枠のコンテキストを維持しながら低時間枠で取引
視覚的明瞭さ
- 色分け:強気(緑)、弱気(赤)—即時のバイアス確認
- カスタマイズ可能:ラインスタイル、太さ、透明度
- クリーンな表示:実体とヒゲが明確に表示
簡単な統合
- 時間枠の切り替え不要
- HTF構造を表示しながらチャートコンテキストを維持
- 軽量でパフォーマンス最適化済み
__________________________________________________________________________________________
その他の無料インジケーター
構造やボリュームから回帰、ボラティリティ、カスタム時間枠まで、幅広い市場分析ツールを探求してください。
ソースコードはGitHub リポジトリで利用可能です。
すべて無料で使用できますが、コーヒーサポートを送りたい場合は こちら からどうぞ。
サポート/レジスタンス
ボリューム
移動平均線
ユーティリティ/カスタム
回帰ベース
ボラティリティ
オシレーター
__________________________________________________________________________________________
免責事項
取引にはリスクが伴います。このインジケーターはテクニカル分析専用です—常に適切なリスク管理を行い、責任を持って取引してください。
フィードバックと改善
ご提案、機能リクエスト、改善アイデアがあれば、ディスカッションタブにコメントを残してください。皆様のフィードバックがインジケーターの改善に役立ちます。