説明
概要
インスタントトレンドラインは、電気技師のジョン・エーラーズによって開発されたテクニカル指標で、金融市場分析にデジタル信号処理(DSP)の原理を応用しています。元々はStocks & Commodities誌(2002年2月号)で発表され、彼の著書「Rocket Science for Traders」および「Cybernetic Analysis for Stocks and Futures」に詳述されています。この指標は、価格データのトレンド成分を抽出し、周期的(振動)成分を除去することでトレンドを特定します。
コンセプト
単に価格データを平滑化する従来の移動平均とは異なり、インスタントトレンドラインは電気工学に由来する数学的手法を用いて価格動作を2つの明確な成分に分解します:
- トレンド成分 - 市場の方向性バイアス
- サイクル成分 - トレンド周辺の振動変動
ノッチフィルターとヒルベルト変換の手法を適用することで、エーラーズは真のトレンド変化に迅速に反応しつつノイズや短期サイクルを除去する指標を作成しました。その結果、同様の期間の単純または指数移動平均と比較して大幅に遅延が減少したトレンドラインが市場状況に適応します。
このアプローチの核心的な利点は、固定された過去期間の価格を単に平均化するのではなく、「トレンド」と「サイクルノイズ」を数学的に正確に分離する点にあります。
動作原理
この指標は、アルファパラメータに基づく再帰的な数式を用いて平滑化されたトレンドラインを計算します。数式には以下が含まれます:
- 現在および最近の価格データ(HL/2の中点)
- 前回のトレンドライン値
- アルファ平滑化係数(デフォルト 0.07)
また、インスタントトレンドラインを2本分シフトさせたトリガーラインを生成し、このトリガーラインを用いてクロスオーバーロジックによる取引シグナルを生成します。
解釈
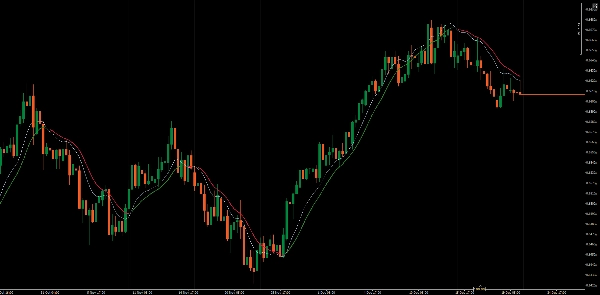
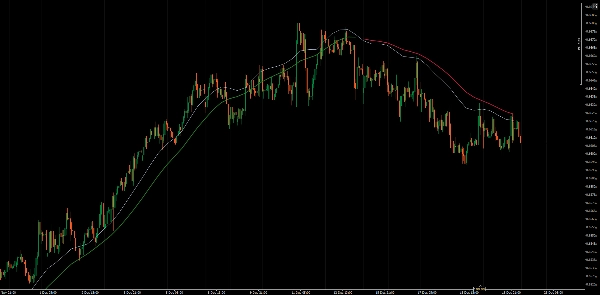
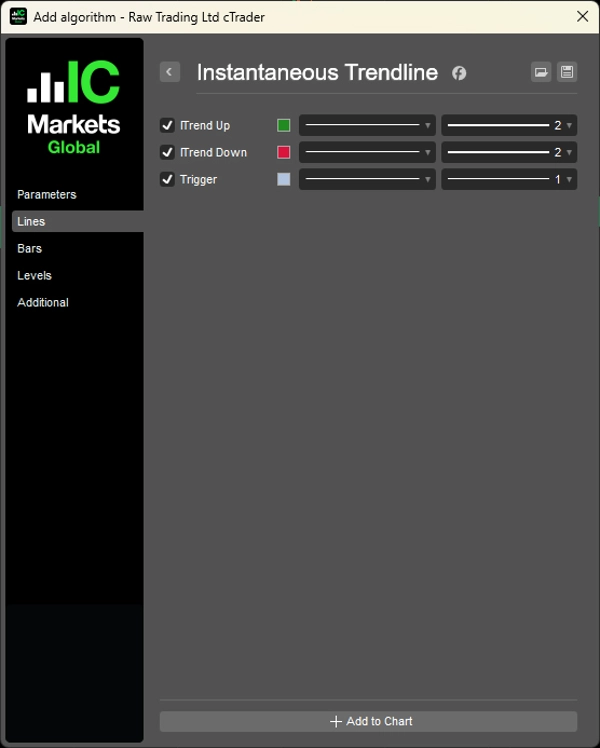
この指標は3本のラインをプロットします:
- ITrend Up: トリガー > ITrend の場合に表示され、強気の状態を示します
- ITrend Down: トリガー < ITrend の場合に表示され、弱気の状態を示します
- Trigger: トレンドラインを2本遅らせたバージョン
シグナル生成:
- 強気シグナル: トリガーラインがインスタントトレンドラインを上抜けたとき
- 弱気シグナル: トリガーラインがインスタントトレンドラインを下抜けたとき
色分けされた表示により、現在のトレンド方向を一目で識別できます。
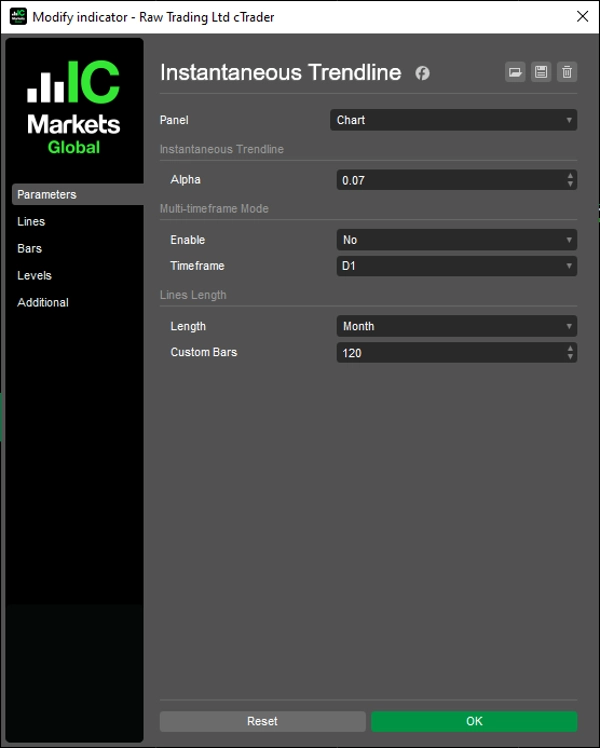
主要パラメータ
アルファ (0.01 - 1.0、デフォルト 0.07)
トレンドラインの平滑化と応答性を制御します。値が低いほど平滑で応答が遅くなり、長期トレンドに適しています。値が高いほど価格変動に敏感になりますが、ノイズの多い市場では誤シグナルが増える可能性があります。デフォルト値の0.07は応答性とノイズフィルタリングのバランスを取っています。
ラインの長さ(デフォルト120)
チャートに表示される過去のトレンドラインデータのバー数を決定します。これにより、チャートを見やすく保ちつつ十分なコンテキストを維持します。
制限事項
- すべてのトレンドフォロー型ツールと同様に、インスタントトレンドラインはレンジ相場や横ばい市場で誤シグナル(ホイップソー)を発生させることがあります
- 強いトレンド時にはトレンドに長く留まることがありますが、正確なトップやボトムを逃す可能性があります
- パフォーマンスは市場状況(トレンド相場かレンジ相場か)によって大きく異なります
- この指標は予測的ではなく反応的であり、トレンドが始まった後に識別します
__________________________________________________________________________________________
その他の無料インジケーター
構造やボリュームから回帰、ボラティリティ、カスタムタイムフレームまで、幅広い市場分析ツールを探索してください。
ソースコードはGitHub リポジトリで利用可能です。
すべて無料で使用できますが、コーヒーサポートを送りたい場合は こちらからどうぞ。
サポート/レジスタンス
ボリューム
移動平均
- SSLチャネル
- アンカード移動平均
- 偏差スケール移動平均
- ギャン高安アクティベーター
- インスタントトレンドライン
- カウフマン適応移動平均(トレンドビジョン付き)
- 移動平均チャネル
- 移動平均スイート
- トレンドチャネル移動平均
ユーティリティ/カスタム
回帰ベース
ボラティリティ
オシレーター
__________________________________________________________________________________________
免責事項
取引にはリスクが伴います。この指標はテクニカル分析専用であり、常に適切なリスク管理を行い、責任を持って取引してください。
フィードバックと改善
ご提案、機能リクエスト、改善案がありましたら、ディスカッションタブにコメントを残してください。皆様のフィードバックが指標の改善に役立ちます。
概要
カスタマーレビュー
5 | 100 % | |
4 | 0 % | |
3 | 0 % | |
2 | 0 % | |
1 | 0 % |