
Opis
Profil Wolumenu Sesji HD
Co To Robi
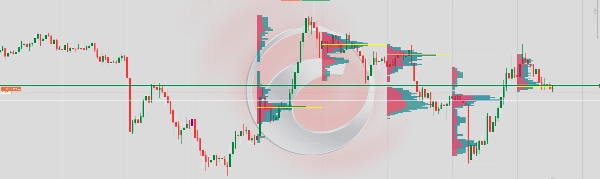
Wyświetla poziomy profil wolumenu poziomego dla każdej sesji handlowej bezpośrednio na wykresie. Pokazuje, jak wolumen handlu jest rozłożony na poziomach cenowych, pomagając traderom zidentyfikować strefy o dużej aktywności, obszary uczciwej wartości oraz kluczowe poziomy wsparcia/oporu wyprowadzone wyłącznie na podstawie zachowania wolumenu.
Jak To Działa
Przy zamknięciu każdej nowej świecy, wskaźnik skanuje wszystkie świece w obrębie zdefiniowanej liczby sesji i rozdziela wolumen ticków każdej świecy na zakres cenowy. Wolumen jest podzielony na stronę kupujących (świece bycze) oraz stronę sprzedających (świece niedźwiedzie) wykorzystując kierunek otwarcia/zamknięcia świecy jako przybliżenie. Wynik jest renderowany jako warstwowy poziomy histogram zakotwiczony do granicy czasowej sesji.
Elementy Wizualne
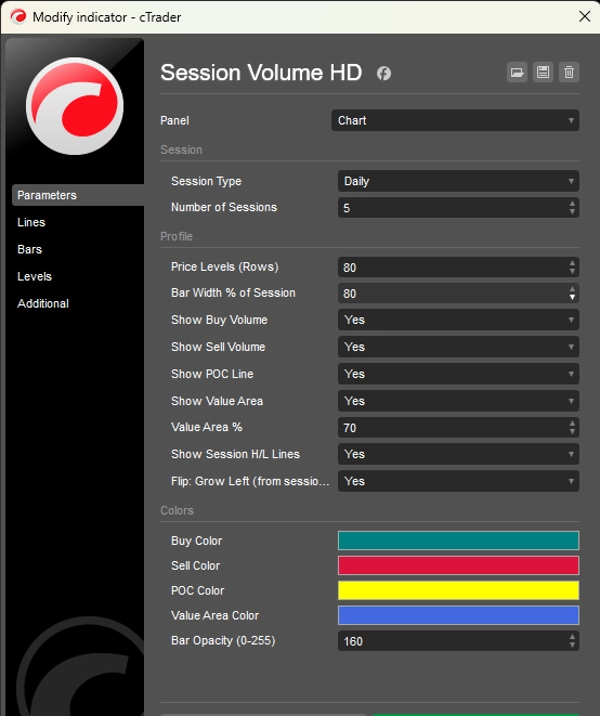
Świece Kupujących (Morski) — Pokazują wolumen handlowany przy byczym ruchu cen na każdym poziomie. Rośnie w lewo (lub w prawo, jeśli odwrócone) od kotwicy sesji.
Świece Sprzedających (Czerwone) — Pokazują wolumen handlowany przy niedźwiedzim ruchu cen na każdym poziomie, ułożone obok świec kupujących.
Linia POC (Żółta) — Punkt Kontroli. Pozioma linia oznaczająca poziom ceny z najwyższym całkowitym wolumenem w sesji. Działa jak magnes dla ceny.
Obszar Wartości (Niebieska nakładka) — Zakres cen zawierający konfigurowalny procent (domyślnie 70%) całkowitego wolumenu sesji. Reprezentuje strefę "uczciwej wartości", gdzie odbył się największy handel.
Linie H/L Sesji (Białe kropkowane) — Oznaczają najwyższą i najniższą cenę osiągniętą podczas sesji.
Wydajność
Wskaźnik przerysowuje się tylko raz na nową świecę, a nie przy każdym ticku. Eliminuje to migotanie i zapewnia stabilne renderowanie nawet przy wielu sesjach i dużej liczbie poziomów cenowych.
Ograniczenia
Ponieważ cTrader nie udostępnia prawdziwego wolumenu bid/ask na poziomie świecy bez danych tickowych, wolumen kupna/sprzedaży jest przybliżony za pomocą kierunku świecy: świece bycze są ważone 65% kupno / 35% sprzedaż, świece niedźwiedzie odwrotnie, a świece doji dzielone są po 50/50. Do uzyskania prawdziwego wolumenu delta wymagana byłaby subskrypcja danych tickowych.


