
Opis
Strefy płynności na mapie cieplnej
Wizualizuj wolumen według ceny, odkrywaj ukryte wsparcia/opory i śledź płynność rynku w czasie rzeczywistym.
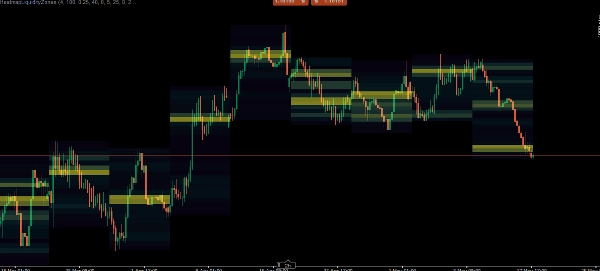
Wskaźnik Stref płynności na mapie cieplnej to potężne narzędzie do profilowania wolumenu, które przekształca surowe dane rynkowe w intuicyjną wizualną mapę cieplną. Analizując wolumen ticków w określonych wyższych ramach czasowych (HTF), identyfikuje dokładnie, gdzie skoncentrowana jest największa presja kupna i sprzedaży.
Zamiast zgadywać, gdzie rynek może się odwrócić, ten wskaźnik rysuje precyzyjne poziomy płynności oparte na wolumenie. Poziomy te dynamicznie rozciągają się do przodu i automatycznie znikają, gdy cena je przebija i unieważnia, utrzymując wykres czystym i ściśle związanym z aktualną akcją cenową.
Kluczowe cechy
Mapa cieplna wielorakich ram czasowych: Wybierz preferowaną makro ramę czasową (1H, 4H, Dzienną, Tygodniową lub Miesięczną). Wskaźnik odwzoruje rozkład wolumenu dla tego konkretnego okresu bezpośrednio na wykresach niższych ram czasowych.
Dynamiczne dzielenie ATR: Skala cenowa jest podzielona na dynamiczne "koszyki" (strefy) obliczane za pomocą Średniego Rzeczywistego Zasięgu (ATR). Zapewnia to, że mapa cieplna inteligentnie dostosowuje się zarówno do rynków o wysokiej zmienności, jak i ściśle konsolidujących się.
Automatyczne unieważnianie poziomów płynności: Gdy określony koszyk cenowy gromadzi ogromną ilość wolumenu, staje się "Poziomem płynności". Wskaźnik rysuje linię ciągłą rozciągającą się w przyszłość. Jeśli cena skutecznie przebije ten poziom, linia jest automatycznie usuwana (unieważniana).
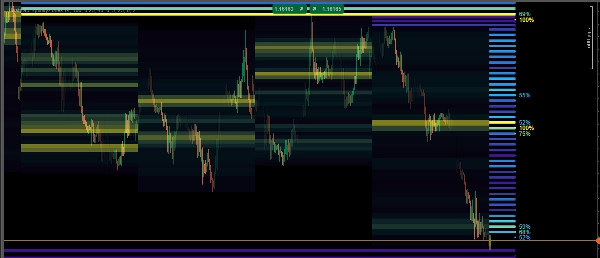
Kolorowanie gradientem gęstości: Wizualnie rozróżniaj między węzłami o niskim, średnim i wysokim wolumenie. Mapa cieplna używa gradientu kolorów, aby pokazać dokładnie, gdzie uwięziony jest największy wolumen.
Śledzenie procentowe: Poziomy płynności o wysokiej gęstości wyświetlają etykietę procentową (np. 85%), pokazując dokładnie, jak silny jest ten węzeł w stosunku do reszty wolumenu okresu HTF.
Podsumowanie
The indicator segments the price scale into dynamic zones based on the Average True Range (ATR), adapting to market volatility. It highlights significant volume clusters as liquidity levels with solid lines extending forward. These lines automatically disappear if the price breaks through the level, ensuring the chart remains focused on relevant, current price action.
A color gradient visually distinguishes low, medium, and high volume nodes, while percentage labels indicate the relative strength of high-density liquidity levels within the chosen timeframe. This tool supports traders in tracking market liquidity in real-time and making volume-backed decisions regarding support and resistance areas.
Opinie klientów
5 | 100 % | |
4 | 0 % | |
3 | 0 % | |
2 | 0 % | |
1 | 0 % |


