


Beschreibung
DIE IDEE
Ein gleitender Durchschnitt, der sich an die Entwicklung eines Trends anpasst, anstatt den Trend in eine feste Periode zu pressen.
DAS PROBLEM
Die meisten gleitenden Durchschnitte erfordern eine feste Rückschauperiode.
Aber Trends entwickeln sich nicht in festen Zeiträumen.
Eine kurze Periode reagiert schnell, kann aber leicht durch kurzfristige Bewegungen gestört werden.
Eine lange Periode glättet mehr Rauschen, kann aber stark verzögert sein, wenn sich der Preis stark bewegt.
Das Problem ist nicht die Wahl der „richtigen“ Periode.
Das Problem ist, dass die Periode selbst fest ist, während sich der Trend ständig entwickelt.
DAS KERNKONZEPT: DER TREND BESTIMMT DIE PERIODE. DER GD PASST SICH DARAN AN.
Traditionelle gleitende Durchschnitte machen die Periode zur primären Referenz.
Der Supertrend-Gleitende Durchschnitt macht die Trendstruktur zur primären Referenz.
Anstatt zu fragen:
„Welche feste GD-Periode soll ich verwenden?“
fragt der Indikator:
„Wie hat sich der aktuelle Trend bisher entwickelt?“
Der Trend bestimmt, wo der adaptive GD beginnt und wie sich seine effektive Länge im Laufe der Zeit entwickelt.
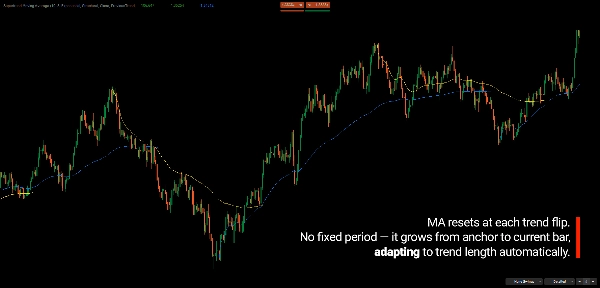
Wenn ein neuer Trend beginnt, wird der GD am strukturellen Extrem des vorherigen Trends verankert und entwickelt sich von diesem Punkt aus nach vorne. Während der neue Trend weitergeht, wächst die effektive Periode mit der Anzahl der Bars, die sich seit der Verankerung entwickelt haben.
Der Trend bestimmt die Struktur. Der GD passt sich daran an.
WAS ER TUT
Der Indikator passt seine effektive GD-Länge dynamisch entsprechend der Entwicklung des aktuellen Trends an.
Ein neu identifizierter Trend beginnt mit einer kürzeren effektiven Länge, wodurch der GD schneller reagieren kann.
Während der Trend anhält, wird die effektive Länge länger, sodass der GD zunehmend glatter wird.
Der GD wird nicht einfach aus einer festen Anzahl der letzten Bars berechnet. Seine Berechnung entwickelt sich von einem strukturellen Anker, der durch den vorherigen Trend festgelegt wurde.
Wenn sich der Trend ändert, wird die strukturelle Referenz zurückgesetzt und eine neue adaptive Messung beginnt.
Dies erzeugt einen gleitenden Durchschnitt, der sein Verhalten entsprechend dem, was der Trend bereits getan hat, ändert.
Er versucht nicht vorherzusagen, wie lange der nächste Trend dauern wird.
Er passt sich der bereits entwickelten Dauer und Struktur an.
WIE ER FUNKTIONIERT
- Supertrend identifiziert den aktuellen Trend und seinen strukturellen Übergang.
- Der Indikator identifiziert den extremen Schlusskurs des vorherigen Trends.
- Dieses strukturelle Extrem wird zum Anker für den adaptiven GD.
- Während sich der neue Trend entwickelt, bestimmt die Anzahl der Bars seit dem Anker die effektive Länge des GD.
- Der GD wird mit dieser sich entwickelnden Länge neu berechnet.
- Wenn sich der Trend ändert, wird die strukturelle Referenz zurückgesetzt und der Prozess beginnt von vorne.
Die adaptive Länge kann mit verschiedenen Methoden zur Berechnung gleitender Durchschnitte kombiniert werden.
ZWEI SICHTEN AUF DEN TREND
Der Indikator bietet zwei Supertrend-Referenzen:
Struktureller Supertrend
Eine breitere Trendreferenz, die größere strukturelle Veränderungen erfassen soll und weniger empfindlich auf kurzfristige Preisvolatilität reagiert.
Originaler Supertrend
Eine reaktivere Referenz, die schneller auf Preisbewegungen reagiert und kurzfristige Momentumverschiebungen innerhalb des breiteren Trends aufzeigen kann.
Die beiden Sichtweisen sind nicht als automatische Signale gedacht.
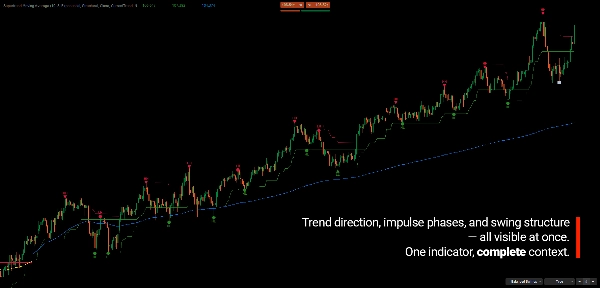
Ihre Beziehung liefert zusätzlichen Kontext darüber, wie sich der Trend entwickelt.
Wenn sich beide Referenzen gemeinsam bewegen, bieten sie eine klarere Sicht auf die Richtungsübereinstimmung.
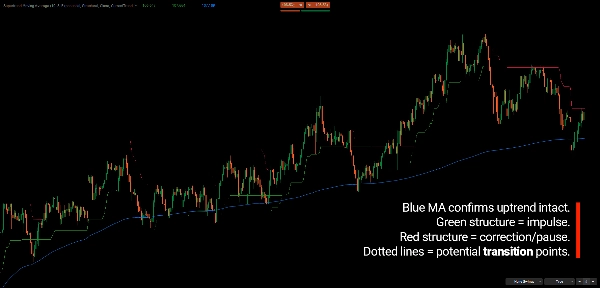
Wenn sie divergieren, kann der Unterschied Kontext für Korrekturen, Übergänge oder kurzfristige Bewegungen innerhalb des breiteren Trends liefern.
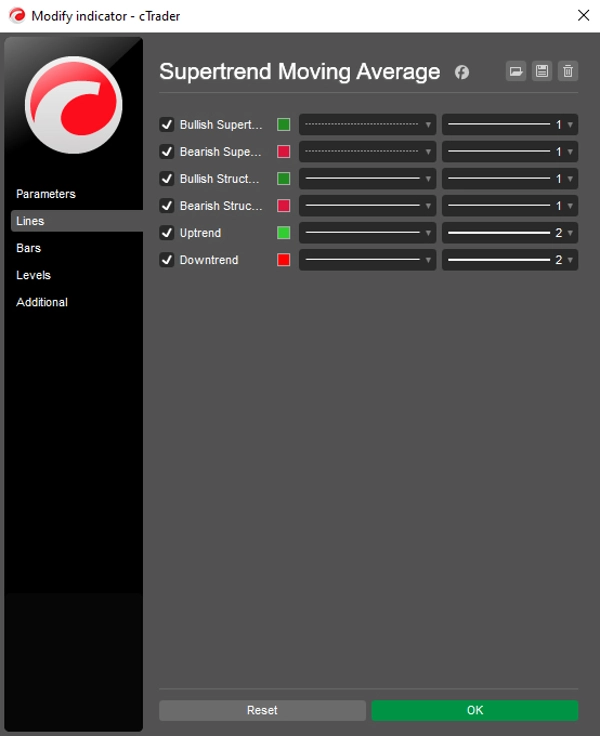
Der originale Supertrend (gepunktet) wird nur auf Bars gezeichnet, bei denen er sich vom strukturellen unterscheidet, sodass Divergenzen hervorgehoben werden. Jede Sicht kann unabhängig ein- oder ausgeblendet werden.
KONTEXT MEHRERER ZEITRAHMEN
Der Trend, der den GD steuert, muss nicht aus dem aktuellen Chart-Zeitrahmen stammen.
Zum Beispiel kann ein Tagestrend einen adaptiven gleitenden Durchschnitt steuern, der in einem H1-Chart angezeigt wird.
Dies ermöglicht es dem Trend eines höheren Zeitrahmens, das Messverhalten zu definieren, während der niedrigere Zeitrahmen eine detailliertere Ansicht der Preisentwicklung bietet.
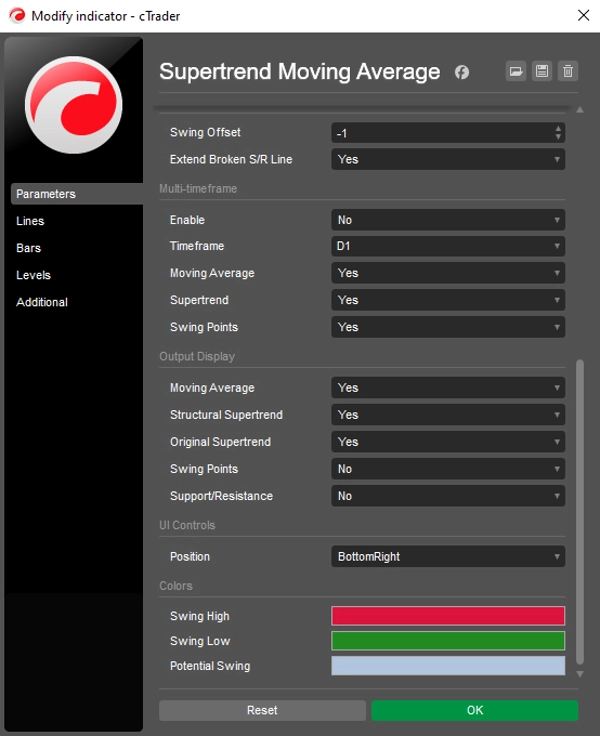
Multi-Timeframe (MTF) umfasst drei Ausgaben, die jeweils unabhängig ein- und ausgeschaltet werden können:
- Gleitender Durchschnitt – der adaptive GD wird vom HTF-Trend gesteuert.
- Supertrend – Struktureller und originaler Supertrend werden auf HTF-Bars berechnet und auf das Chart übertragen. Sie aktualisieren sich bei jedem Tick, während der HTF-Bar noch gebildet wird.
- Swing-Punkte – Swings und automatische Unterstützung/Widerstand werden auf HTF-Bars berechnet. Marker befinden sich am tatsächlichen Preisaus extrem innerhalb des HTF-Bars, und Sweep, Flip und Ungültigmachung werden beim Schließen des HTF-Bars bewertet. S/R-Labels und Linienendpunkte aktualisieren sich weiterhin bei jedem Chart-Bar.
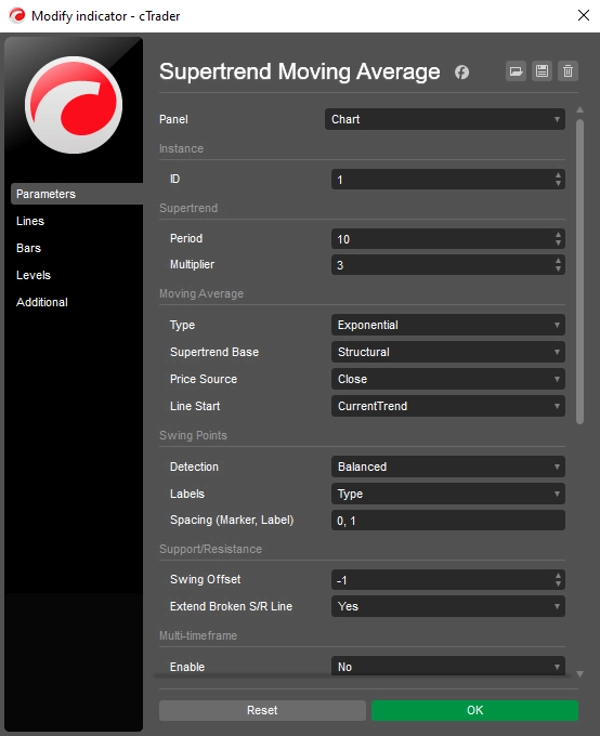
Die Multi-Timeframe Parametergruppe enthält Aktivieren, Zeitrahmen und jeweils einen Schalter für Gleitenden Durchschnitt, Supertrend und Swing-Punkte. MTF ist standardmäßig deaktiviert; sobald aktiviert, verwenden alle drei Ausgaben den ausgewählten Zeitrahmen, es sei denn, sie werden einzeln ausgeschaltet.
Der MTF-Zeitrahmen kann höher, gleich oder niedriger als der Chart-Zeitrahmen sein. Wenn er niedriger oder gleich dem Chart-Zeitrahmen ist, verwendet jeder Chart-Bar den letzten HTF-Bar darin (den Wert beim Schließen des Chart-Bars), und Swing-Marker befinden sich auf dem Chart-Bar, der die Eröffnung des HTF-Bars enthält.
Hinweis: Der HTF-GD bewertet jeden HTF-Bar, wenn er erstmals erscheint, sodass er sich nicht ändert, während dieser Bar noch gebildet wird.
AUTOMATISCHES LADEN DER VERLAUFSDATEN
Der HTF-GD benötigt genügend Chart-Verlauf, um den Trend des höheren Zeitrahmens wiederherzustellen. Wenn der Chart zu wenige Bars hat, fordert der Indikator selbstständig mehr Verlauf an und wiederholt dies, bis die Anforderung erfüllt ist.
Eine Warnung im Chart („Lade N weitere Bars“) erscheint nur als letzte Maßnahme: wenn kein weiterer Verlauf verfügbar ist, die letzte Anforderung nichts hinzugefügt hat, die Anforderung abgelaufen ist oder die Anforderung sehr groß ist.
OPTIONALER SWING-KONTEXT
Der Indikator kann auch Swing-Informationen anzeigen wie:
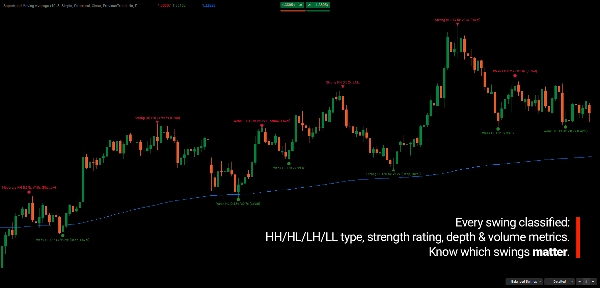
- HH / HL / LH / LL
- Swing-Stärke
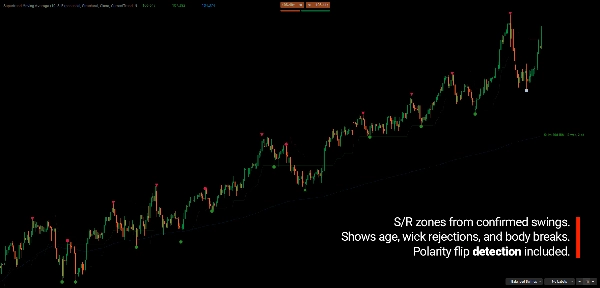
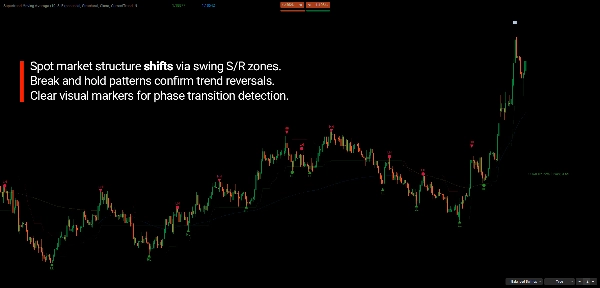
- Swing-Zonen und automatische Unterstützung/Widerstand
- Swing-Polarität
- Swing-Beziehungen
Diese bieten zusätzliche Preisgeometrie rund um den adaptiven GD, ohne dessen Kernberechnung zu verändern.
Swing-Punkte und S/R schalten unabhängig (S/R erfordert Swing-Punkte). Ihre S/R-Auswahl bleibt erhalten, wenn Swing-Punkte ausgeschaltet sind, und gilt wieder, wenn Sie sie wieder einschalten.
AUSGABEDARSTELLUNG
Wählen Sie genau aus, was gezeichnet wird: GD, Struktureller Supertrend, Originaler Supertrend, Swings und Unterstützung/Widerstand. Standardmäßig sind GD, Strukturell und Original aktiviert; Swings und S/R sind deaktiviert.
- Das Ausblenden einer Ausgabe überspringt auch deren Berechnung. Bei ausgeschaltetem GD wird alle GD-Arbeit (nativ und HTF, einschließlich Laden von HTF-Bars) übersprungen; bei ausgeschalteten Swings werden Swing-Erkennung und Darstellung übersprungen.
- Der gepunktete originale Supertrend erscheint weiterhin nur dort, wo er sich vom strukturellen unterscheidet, selbst wenn die strukturelle Linie ausgeblendet ist.
- Der Swing-Offset reicht von -100 bis -1 (Standard -1). Das Anzeigen oder Ausblenden von S/R wird durch den S/R-Schalter gesteuert.
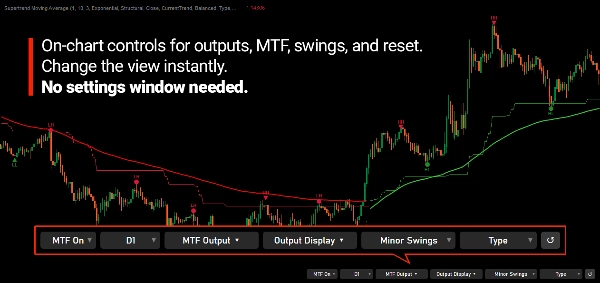
STEUERUNGEN AUF DEM CHART
Ändern Sie, was Sie sehen, ohne den Parameterdialog erneut zu öffnen:
- Ausgabedarstellung – Kontrollkästchen für GD, Struktureller Supertrend, Originaler Supertrend, Swings und Unterstützung/Widerstand. Mindestens eines von GD, Struktureller Supertrend, Originaler Supertrend oder Swings bleibt aktiviert.
- MTF – Ein/Aus, HTF-Zeitrahmen und MTF-Ausgabe (GD, Supertrend, Swings; mindestens eines bleibt aktiviert). Änderungen werden sofort angewendet, ohne den Indikator neu zu laden: GD, Supertrend und Swings werden bei Bedarf neu aufgebaut.
- Swing-Steuerungen – Erkennungsmodus, Label-Anzeige und S/R-Offset. Wenn Swings ausgeschaltet sind, werden sie ausgeblendet und Swing- sowie S/R-Objekte vom Chart entfernt; die Offset-Schaltflächen erscheinen nur, wenn sowohl Swings als auch S/R eingeschaltet sind.
- Reset-Knopf (↺) – stellt alle Steuerungen, einschließlich MTF- und Swing-Steuerungen, auf die Werte des Parameterdialogs zurück.
- Gespeicherte Einstellungen – On-Chart-Auswahlen (einschließlich MTF- und Swing-Steuerungen) werden pro Symbol und Instanz-ID gespeichert und beim nächsten Mal wiederhergestellt. Wenn Sie einen Parameter im Dialog ändern, hat dieser Wert Vorrang vor dem gespeicherten.
- Instanz-ID – verwenden Sie verschiedene IDs, um separate Einstellungen für mehrere Instanzen desselben Symbols zu behalten.
- Umschalten – Das Einschalten des GD baut ihn neu auf (nativ und HTF) und das Ausschalten löscht ihn. Das Umschalten eines Supertrends aktualisiert nur dessen eigene Ausgabe.
WAS SIE BEOBACHTEN KÖNNEN
Der Indikator ist darauf ausgelegt, mehrere Dinge sichtbar zu machen:
- Aktuelle Trendrichtung
- Trendlänge
- Veränderungen in der Trendstruktur
- Rücksetzer und Korrekturen
- Fortsetzung nach Korrekturen
- Kontext höherer Zeitrahmen
- Veränderungen im Preisverhalten um den adaptiven Mittelwert
Der GD ist ein Messwerkzeug, kein eigenständiges Kauf-/Verkaufssystem.
ENTWICKELT FÜR ADAPTIVE MESSUNG
Das Ziel ist nicht, eine perfekte GD-Periode zu finden.
Es geht darum, die Annahme zu entfernen, dass eine feste Periode während der gesamten Lebensdauer eines Trends angemessen bleiben sollte.
Ein neuer Trend und ein ausgereifter Trend sind unterschiedliche Phasen derselben Bewegung.
Der gleitende Durchschnitt passt sich dieser Entwicklung an, anstatt beide Phasen gleich zu behandeln.
Das Ziel ist nicht, eine feste GD-Periode ständig zu optimieren. Die Periode entwickelt sich automatisch aus der Trendstruktur und der bereits erfolgten Preisbewegung.
HAUPTMERKMALE
- Trendstruktur-basierter adaptiver GD
- Struktureller Anker basierend auf dem extremen Schlusskurs des vorherigen Trends
- Effektive GD-Länge entwickelt sich mit dem neuen Trend
- Automatischer struktureller Reset bei Trendwechsel
- Mehrere Methoden zur GD-Berechnung
- Strukturelle Supertrend-Ansicht
- Originale Supertrend-Ansicht
- Kontext zwischen struktureller und reaktiver Trendansicht
- Optionale Swing-Informationen und automatische Unterstützung/Widerstand
- HH / HL / LH / LL Klassifikation
- Swing-Stärke und Zonen
- Multi-Timeframe für GD, Supertrend und Swing-Punkte, jeweils unabhängig
- HTF kann niedriger, gleich oder höher als der Chart-Zeitrahmen sein
- Live HTF Supertrend, während der HTF-Bar gebildet wird
- Ausgabedarstellung und MTF-Steuerungen direkt auf dem Chart
- Reset-Knopf, gespeicherte Einstellungen und Instanz-ID
- Automatisches Laden des Chart-Verlaufs für den HTF-GD
- Anpassbare Darstellung
WICHTIG ZU WISSEN
- Der HTF-GD bewertet jeden HTF-Bar einmal, wenn er erstmals erscheint, sodass er sich nicht ändert, während dieser Bar noch gebildet wird. Der HTF-Supertrend aktualisiert sich jedoch live.
- Die Warnung „Lade N weitere Bars“ und das automatische Laden des Verlaufs gelten nur für den HTF-GD.
- Der Swing-Abstand ist ein fester Pip-Wert, daher kann der Marker-Offset bei HTF-Swings klein erscheinen.
- Die Swing-Neuberechnung läuft im UI-Thread, sodass Charts mit sehr langem Verlauf kurzzeitig einfrieren können, wenn Swings neu berechnet werden.
- Swings, die aus dem 100-Swing-Verlauf entfernt wurden, behalten ihre Chart-Objekte.
---
Dieser Indikator ist ein Werkzeug zur Marktanalyse und bietet keine Finanzberatung oder Garantie für Handelsergebnisse.
Zusammenfassung
The indicator integrates dual Supertrend analyses: a Structural Supertrend that identifies major trend direction by filtering out noise and confirming genuine directional changes, and the Original Supertrend that highlights momentum shifts within the trend. Comparing these two provides context for distinguishing strong trend continuation from corrective movements.
Key features include:
- Adaptive anchor-based moving averages with options for Simple, Exponential, or Arnaud Legoux (ALMA) types.
- Multi-timeframe capability to apply higher timeframe Supertrend context on lower timeframe charts.
- Integrated swing detection with configurable modes and strength classification.
- Color-coded trend lines and swing markers for clear visual interpretation.
This tool is suited for trend and swing traders, multi-timeframe analysts, and discretionary traders seeking a structural framework to track trend development and market rhythm objectively. It emphasizes market structure and context over fixed signals, supporting clearer interpretation of price behavior.
Kundenbewertungen
5 | 67 % | |
4 | 33 % | |
3 | 0 % | |
2 | 0 % | |
1 | 0 % |
Diskussion
Häufig gestellte Fragen (FAQ)





















Preis