


Description
Overview
MarketStructurePro is a professional swing detection indicator that automatically identifies and classifies key market turning points using fractal analysis. It highlights four essential swing types: Higher Highs (HH), Higher Lows (HL), Lower Highs (LH), and Lower Lows (LL).
Works on all instruments (Forex, Crypto, Indices, Commodities) and timeframes.
How It Works
The indicator analyzes price action data (High, Low, Close) to detect significant swing points using fractal mathematics. It evaluates local peaks and troughs, compares consecutive swings to determine trend direction, and identifies market structure shifts when swing patterns change.
Works effectively in:
- Trending markets - identifies continuation patterns
- Range-bound markets - defines support/resistance levels
- Volatile markets - highlights key turning points
- All timeframes - from 1-minute to monthly charts
Signal Interpretation
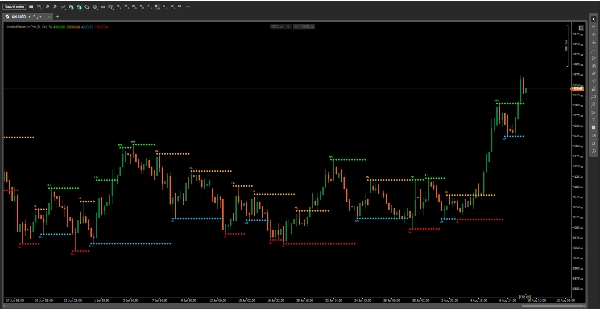
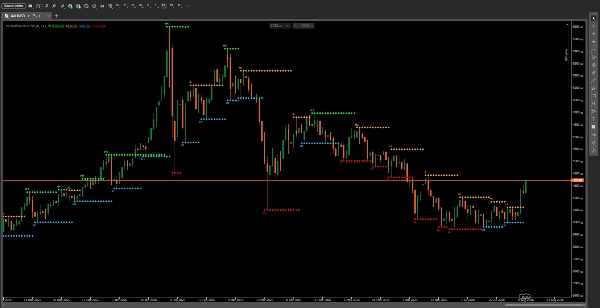
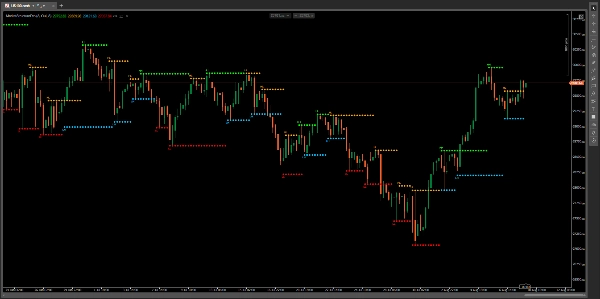
The indicator displays 4 color-coded points directly on your chart:
Higher High (HH) - Lime Green
A new high higher than the previous high. Indicates bullish continuation and uptrend gaining strength.
Higher Low (HL) - Orange
A new low higher than the previous low. Indicates bullish structure with support moving up.
Lower High (LH) - Deep Sky Blue
A new high lower than the previous high. Indicates bearish structure with resistance moving down.
Lower Low (LL) - Red
A new low lower than the previous low. Indicates bearish continuation and downtrend gaining strength.
Reading Market Structure:
- HH + HL increasing = Strong Uptrend
- LH + LL decreasing = Strong Downtrend
- Failed HH followed by LH = Potential Bearish Reversal
- Failed LL followed by HL = Potential Bullish Reversal
Key Settings
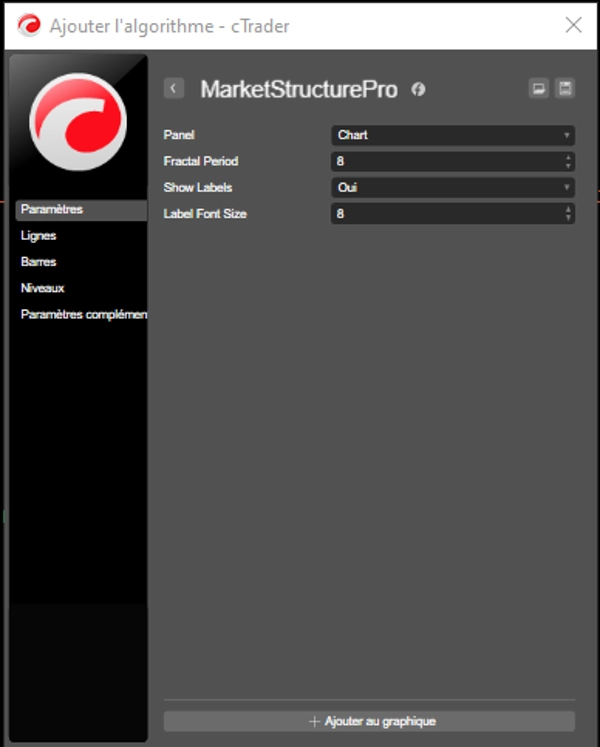
Fractal Period (Default: 8)
Number of candles used to identify swing points. Higher values produce fewer but more significant swings. Lower values produce more signals for earlier detection.
Show Labels (Default: True)
Toggle text labels (HH/HL/LH/LL) on or off for cleaner charts.
Label Font Size (Default: 8)
Adjust the size of swing labels for better visibility.
Suggested Periods:
- Period 5-7: Day trading and scalping
- Period 8-12: Swing trading
- Period 14-20: Position trading
Trading Scenarios
Trend Following
Identify existing trend using HH/HL or LH/LL patterns. Enter on pullbacks to HL (uptrend) or LH (downtrend). Place stop loss below the last HL or above the last LH. Target the next HH or LL.
Breakout Trading
Watch price approach a previous HH or LL. Enter when price breaks above HH (long) or below LL (short). Place stop loss below the breakout candle or nearest swing point.
Reversal Detection
Watch for failed breakouts. HH followed by LH indicates potential bearish reversal. LL followed by HL indicates potential bullish reversal.
Support & Resistance
Use HH and LL as key levels. Draw horizontal lines for entries and exits. Buy at HL support, sell at LH resistance.
Smart Money Concepts (SMC)
Identify Break of Structure (BoS) and Change of Character (ChoCh). Enter on structure breaks with stops beyond the last swing point.
Who Is It For?
Perfect for:
- Price Action Traders
- SMC (Smart Money Concept) Traders
- Trend Followers
- Swing Traders
- Day Traders
Experience Level:
Suitable for all levels - beginners to advanced. Visual and easy to understand for new traders while providing professional structure analysis for experienced traders.
Important Limitations
Lagging Indicator
Fractals are identified after formation, requiring 2 candles confirmation. Signals are reactive, not predictive.
Less Effective in Ranging Markets
Can produce frequent signals in sideways conditions. Use higher fractal period to reduce noise.
May Miss Sharp Moves
Extreme volatility can create swings that bypass fractal detection.
Usage Notes:
- Always use confluence with other indicators
- Higher timeframe structure is more significant
- Not every swing point is a trading signal
- Adjust period based on market volatility
- Always backtest first
Disclaimer
Past performance does not guarantee future results. This indicator is a tool to assist analysis, not a trading system. Always manage risk appropriately. Trading involves significant risk. Consult a financial advisor before making trading decisions.
Ready to Master Market Structure?
MarketStructurePro transforms complex price action into clear, actionable signals. Download now and see the market structure clearly!
Tags
Market Structure, SMC, Swing, Fractals, Price Action, Smart Money, Trend
Summary
The indicator displays color-coded points on the chart—lime green for HH, orange for HL, deep sky blue for LH, and red for LL—helping traders interpret market trends, potential reversals, and support/resistance levels. It supports various trading scenarios such as trend following, breakout trading, reversal detection, and SMC strategies by identifying Break of Structure (BoS) and Change of Character (ChoCh).
Key settings include adjustable fractal periods to control signal sensitivity and label display options. MarketStructurePro is suitable for all experience levels and trading styles, including price action, swing, and day trading. It is a reactive tool that requires confirmation and should be used alongside other indicators for comprehensive analysis.
















!["[Stellar Strategies] Inside Bar with Signals" logo](https://cdn.ctrader.com/image/webp/1d9e8bfa-3b2c-4440-bb37-5856902008a7_30683)










