
Description
## 📊 What is Squeeze Momentum Pro?
Squeeze Momentum Pro is a professional volatility and momentum indicator based on the renowned squeeze strategy popularized by John Carter. It identifies periods of market compression (squeeze) and anticipates explosive breakout movements before they occur.
The indicator combines two powerful volatility measurement tools:
- **Bollinger Bands** (20-period, 2.0 standard deviation)
- **Keltner Channels** (20-period, 1.5 ATR multiple)
When Bollinger Bands contract inside Keltner Channels, a "squeeze" is detected, signaling that the market is building energy for a potential explosive move.
## 🎯 Key Features
### 1. Squeeze Detection System
- **Black Dots** = Squeeze Active (market is compressing, prepare for breakout)
- **Blue Dots** = Squeeze Released (breakout is occurring, look for momentum direction)
- **Gray Dots** = No Squeeze (normal market conditions)
### 2. Momentum Histogram
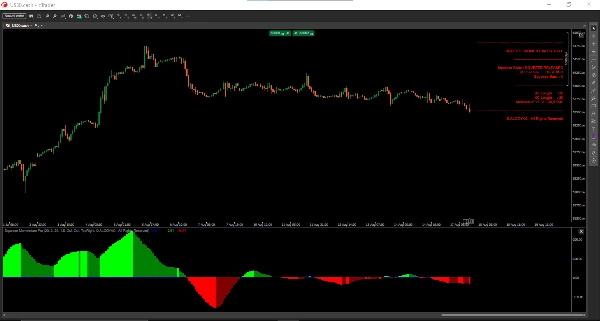
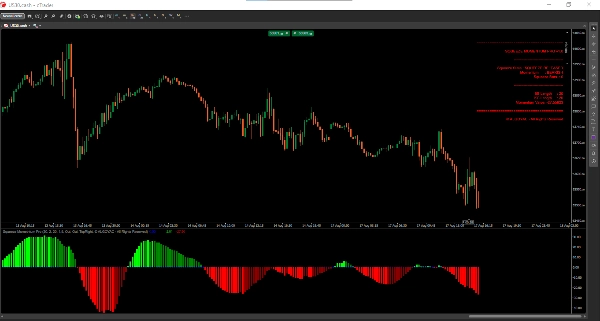
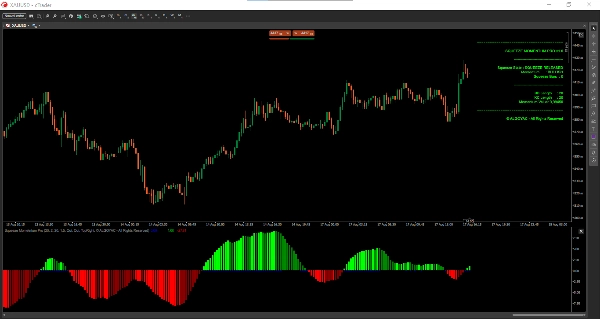
The histogram displays market momentum with 4 distinct colors:
- **Lime Green** = Strong bullish momentum (increasing)
- **Dark Green** = Weak bullish momentum (decreasing)
- **Red** = Strong bearish momentum (decreasing)
- **Maroon** = Weak bearish momentum (increasing)
### 3. Real-Time Dashboard
Built-in dashboard showing:
- Current squeeze state
- Momentum direction
- Number of bars in squeeze
- Active parameters
## 📈 How to Interpret Signals
### Squeeze + Momentum Breakout
When the histogram changes from red to lime green while coming out of a squeeze (black dots), this represents a strong bullish signal.
### Squeeze Duration
Longer squeeze periods often lead to more powerful breakouts. The dashboard displays the number of bars in squeeze to help gauge potential volatility.
### Momentum Color Transitions
- **Red → Maroon** : Selling pressure decreasing, potential reversal
- **Lime → Green** : Buying pressure decreasing, potential reversal
- **Maroon → Lime** : Strong bullish reversal
- **Green → Red** : Strong bearish reversal
## ⚙️ Settings & Parameters
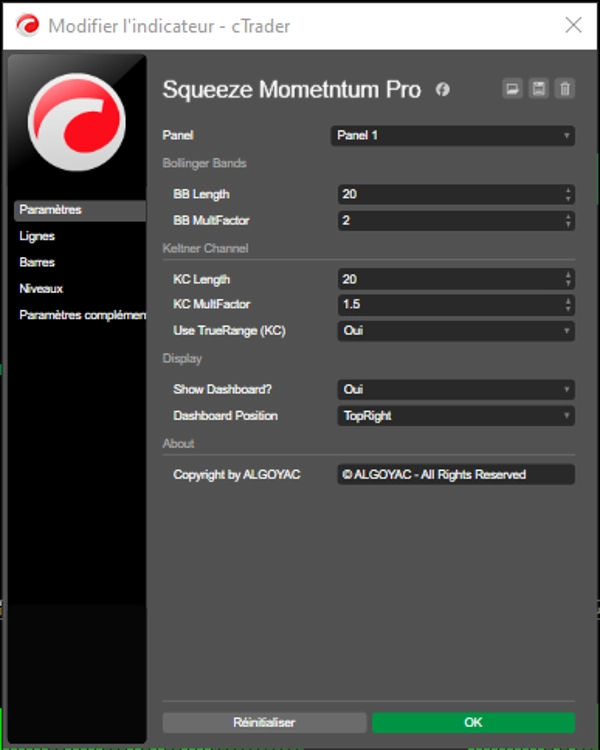
### Bollinger Bands Group
- **BB Length** (default: 20) : Period for Bollinger Bands calculation
- **BB MultFactor** (default: 2.0) : Standard deviation multiplier
### Keltner Channel Group
- **KC Length** (default: 20) : Period for Keltner Channel calculation
- **KC MultFactor** (default: 1.5) : ATR multiplier
- **Use TrueRange** (default: true) : Toggle between True Range and High-Low range
### Display Group
- **Show Dashboard** (default: true) : Display real-time information panel
- **Dashboard Position** : Choose from 4 positions
## 💼 Typical Use Cases
### Scalping
- Use on M1-M5 timeframes
- Enter on squeeze release with momentum confirmation
- Exit when momentum color changes
### Day Trading
- Use on M15-H1 timeframes
- Combine with support/resistance levels
- Enter on first pullback after squeeze release
### Swing Trading
- Use on H4-D1 timeframes
- Look for multi-bar squeezes
- Enter on momentum color transition from red to lime (or vice versa)
## 👥 Who is This Indicator For?
### Suitable for:
- **Breakout traders** : Identify momentum before breakouts
- **Volatility traders** : Gauge market compression phases
- **Momentum traders** : Follow trend strength and reversals
- **Beginner to Advanced** : Intuitive interface with professional features
### Experience Level:
- **Beginners** : Start with default settings, use dashboard for guidance
- **Intermediate** : Adjust parameters for specific markets
- **Advanced** : Combine with price action and multiple timeframes
## ⚠️ Important Notes & Limitations
1. **False Breakouts** : Not all squeezes result in strong breakouts. Always use additional confirmation.
2. **Market Conditions** : Works best in trending markets. May give false signals in ranging markets.
3. **Parameter Sensitivity** : Default settings work well for most markets but may need adjustment for specific instruments.
4. **Not a Standalone System** : Best used with other technical analysis tools for confirmation.
5. **Past Performance** : Historical signals don't guarantee future results.
## 🔧 Recommended Settings by Market
| Market | BB Length | KC Length | Timeframe |
|--------|-----------|-----------|-----------|
| Forex | 20 | 20 | H1-H4 |
| Stocks | 20 | 20 | D1 |
| Crypto | 30 | 30 | H1-H4 |
| Indices| 25 | 25 | M15-H1 |
## 🚀 Getting Started
1. Add the indicator to your chart
2. Keep default settings initially
3. Watch for black dots (squeeze forming)
4. Wait for squeeze release (blue dots)
5. Confirm with momentum color (lime for buy, red for sell)
6. Use the dashboard for quick reference
Summary
Key features include a squeeze detection system with color-coded dots (black for active squeeze, blue for squeeze release, gray for no squeeze), and a momentum histogram displaying four colors to represent bullish and bearish momentum strength and direction. A real-time dashboard provides current squeeze status, momentum direction, squeeze duration, and active parameters.
The indicator supports multiple trading styles and timeframes: scalping (M1-M5), day trading (M15-H1), and swing trading (H4-D1). It is suitable for breakout, volatility, and momentum traders across markets such as Forex, stocks, crypto, and indices, with recommended parameter settings for each.
Users interpret signals by monitoring squeeze states and momentum color transitions to identify potential entries and exits. Adjustable settings allow customization of Bollinger Bands and Keltner Channel parameters, as well as dashboard display options. The indicator is designed for use alongside other technical analysis tools to confirm signals.
Customer reviews
5 | 50 % | |
4 | 50 % | |
3 | 0 % | |
2 | 0 % | |
1 | 0 % |