Brokers & props
For business
00
Days
:
00
Hours
:
00
Minutes
:
00
Seconds
Indicator
Indices
Prop
Commodities
Stocks
Forex
Crypto
LT_Ind_Pivot
02/01/2026
1
Desktop
Since 25/09/2024
Sales
24
"LT_Ind_Pivot" uploaded image"LT_Ind_Pivot" uploaded image

Note: Tested on cTrader Windows only.

LT_Ind_Pivot is a powerful, customizable Pivot Point indicator for cTrader that helps visualize key market levels and session structures across multiple timeframes.

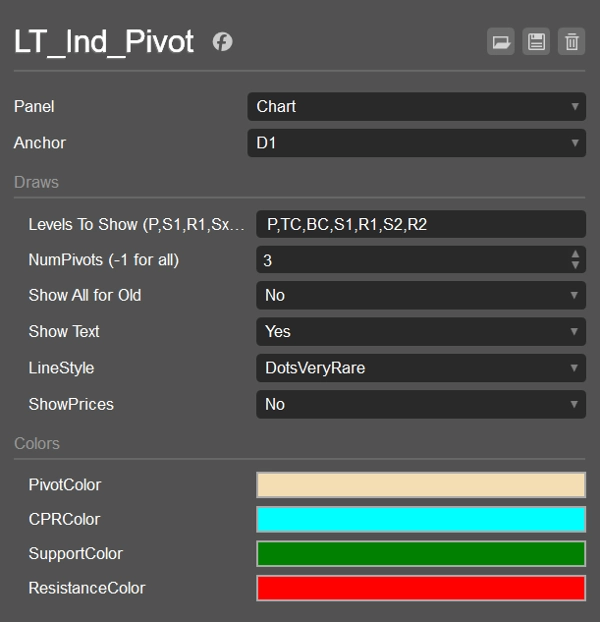
It automatically calculates and plots Pivot (P), Support (S1–S5), Resistance (R1–R5), and CPR (TC/BC) levels based on your chosen Anchor timeframe — from H1, H4, H8, H12, D1, W1, to Month1.
The indicator also draws vertical separator lines for each anchor period, both on the main chart and indicator panels, making it easy to distinguish session or period boundaries.

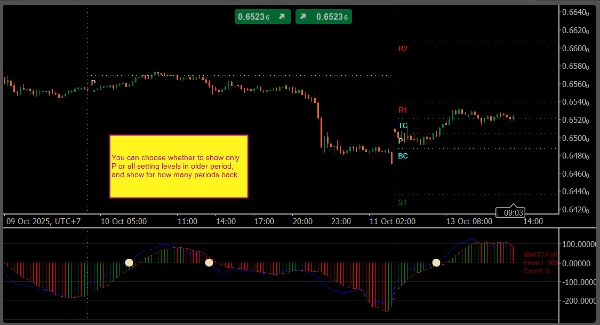
You can define exactly which levels to show using flexible notation such as:

  • P, S1, R1 – standard levels
  • PS1, S1S2, R1R2, etc. – mid-levels between pivots and main supports/resistances
  • TC, BC – Central Pivot Range (CPR)

Display controls let you set how many historical pivots to keep visible, whether to show text/price labels, and how to color or style each level.


Main Features

  • Pivot anchors: H1, H4, H8, H12, D1, W1, Month1
  • Custom level syntax: P, Sx, Rx, PS1, S1S2, R1R2, TC, BC
  • Vertical period separators on chart and indicator panels
  • Option to show text, prices, and old pivot levels
  • Full color and line-style customization
  • Lightweight and suitable for live trading


Default Settings

  • Anchor: D1
  • Show Levels: P,S1,R1
  • NumPivotsBack: 1
  • ShowAllForOldPivots: false
  • Show Text: true
  • Show Prices: false
  • LineStyle: Solid
  • Colors: Pivot = Wheat, CPR = Cyan, Support = Green, Resistance = Red


Use Cases

  • Mark intraday and swing support/resistance zones
  • Track CPR and mid-levels for breakout or mean-reversion setups
  • Use period separators to analyze session-by-session structure
  • Combine with VWAP or Swing indicators for higher confluence
0.0
Reviews: 0
Customer reviews
No reviews for this product yet. Already tried it? Be the first to tell others!
More from this author
cBot
ATR
LT_RiskGuardian
Auto-manages SL, TP, and position size to enforce risk discipline. Never enter a trade without a plan again.
LT Flexible Volume Profile
Flexible Volume Profile, designed with performance in mind.
Indicator
Breakout
ATR
LT_SmartSwings
Detects swing highs/lows, structure, breakouts, trend lines, and fibs — great for price action trading.
Indicator
Indices
Commodities
ATR
+4
LT_Ind_Candles
Most used candle patterns. (1 candle, 2 candles and 3 candles patterns) and Marubozu. Bonus Fibo Risk control.
Indicator
Indices
Prop
Stocks
+3
LT_Ind_SRZones
Automatic Support/Resistance zones from swing points.
Indicator
VWAP
Indices
Prop
+4
LT_Ind_VWAP
Multi-anchor VWAP indicator for cTrader. Plots two VWAP lines (red and blue) with selectable anchors.
LT_FairValueGap
Detects valid Fair Value Gaps from strong 3-bar patterns. Keep drawing unfilled gaps until price fills them.
Indicator
Indices
Prop
Commodities
+3
LT_Ind_TradeNet
Personal trade tracker for a single symbol. Clear net profit summary — FreshNet, ManageNet, DayNet, WTDNet, MTDNet.
You may also like
Indicator
Indices
Breakout
Prop
+7
Swing Anchored Vwap - Pro ( + Alerts )
VWAP anchored to swings with real-time alerts. Your pro edge for precise entries/exits.
Indicator
NAS100
NZDUSD
XAUUSD
+10
Market Structure Shift
Market Structure Shift – Professional Market Structure Oscillator
Indicator
RSI
XAUUSD
Breakout
+6
Market Imbalance
Identifies market imbalances and visually marks key areas based on price patterns and volatility (ATR).
Indicator
Breakout
Institutional Flow Radar
Institutional Flow Radar scans the chart for abnormal volume events and classifies them into two groups: Capital &Public
Indicator
RSI
Signal
MA-RSI HTF Confirmation
MA-RSI HTF Confirmation: Eliminate false signals and trade with confidence!
Indicator
NAS100
NZDUSD
Martingale
+26
Trend & Volume Regime Map
Trend & Volume Regime Map – A normalized price & volume regime map for cTrader that scores trend from –10 to +10, colors
Fury Team E_M_A_su_TF
EMA ON TF (MULTI-TIMEFRAME)
Indicator
Indices
XAUUSD
Forex
+3
Three Candle Patterns
Spot powerful 3-candle reversal patterns like Morning/Evening Star and Soldiers/Crows at key swing highs and lows
Indicator
Indices
Prop
Stocks
+6
New Way Sar - Pro
The Parabolic SAR, or "Stop and Reverse," is a dynamic technical analysis tool
Indicator
RSI
Breakout
XAUUSD
+12
Liquidity Pressure Index
Liquidity Pressure Index is a tool that gives traders deeper insights into the hidden dynamics of market liquidity
Indicator
RSI
Breakout
Supertrend
+3
Fibonacci Linear Regression Multi-timeframe
Combining Fibonacci levels and regression to analyze multidimensional market trends across multiple timeframes¡
Breakout Mode Patterns
Brooks price action breakout mode patterns
Indicator
Bollinger
E7 Indicators Free Studies
ADXR, KDJ, SineWave, Bollinger Band Volatility and AEOscillator.
Indicator
Indices
Stocks
Forex
+2
HorizontalSupportResistance
This extraordinary multi-timeframe support and resistance indicator is nothing short of market wizardry.
[Hamster-Coder] Pivot Points (Demo)
[Hamster-Coder] Pivot Points (Demo)
Indicator
NAS100
NZDUSD
XAUUSD
+10
MarketSession-MX
😎Read the description before purchasing💩
Indicator
Stocks
ATR
Forex
+1
TwoSMA PRO
TwoSMA indicator detects trend via SMA crossover, filters flat markets with ATR, and provides clear BUY and SELL signals